PHOENIX, AZ — The Arizona Section of the American Society of Civil Engineers (ASCE Arizona) released the 2026 Report Card for Arizona's Infrastructure, assigning the state’s infrastructure a grade of C, the same grade Arizona received in its last infrastructure report card in 2020. The report covers 11 categories of infrastructure: aviation, bridges, dams, drinking water, energy, levees, rail, roads, stormwater, transit, and wastewater. Individual chapter grades are below:
- Bridges: B+
- Aviation: B-
- Energy, levees, rail, transit, wastewater: C
- Dams, drinking water, stormwater: C-
- Roads: D+
Arizona is experiencing some of the most rapid population growth and business development in the nation and, currently, the state’s relatively young infrastructure networks are supporting this growth. Eight of the 11 categories in the report have higher grades than in the national report card and several categories have strong condition ratings. While these are positive trends leading to a stronger economy and more robust communities, the additional activity means infrastructure capacities must be expanded, and current systems will have greater maintenance needs. Increasingly frequent extreme weather events are also adding strain to some of the state’s aging assets.
“Arizona has so many great attributes that draw tourists, new residents, and business opportunities to our state, but we can only sustain our way of life and growth if we prioritize the infrastructure that gets us where we need to go, keeps the lights on, and protects us from environmental hazards,” said Frederick Tack, PE, ASCE Arizona Section President.
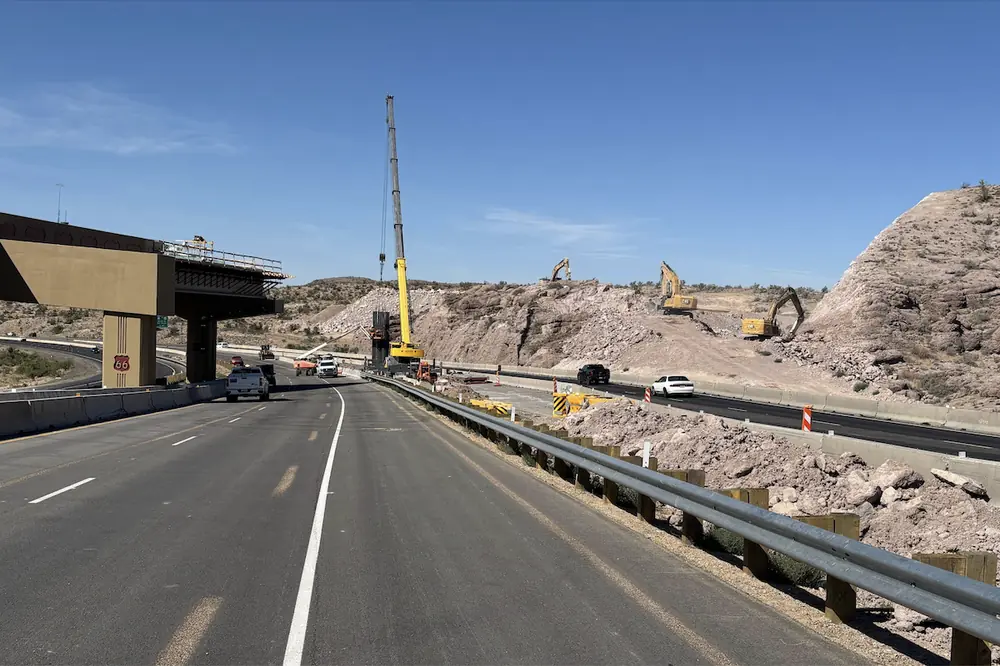
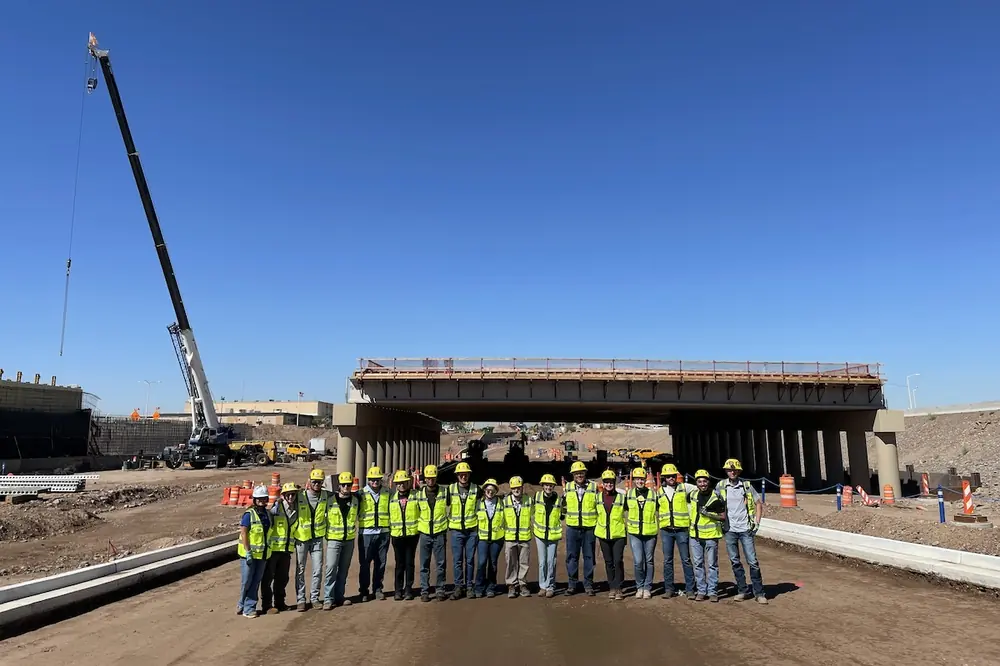
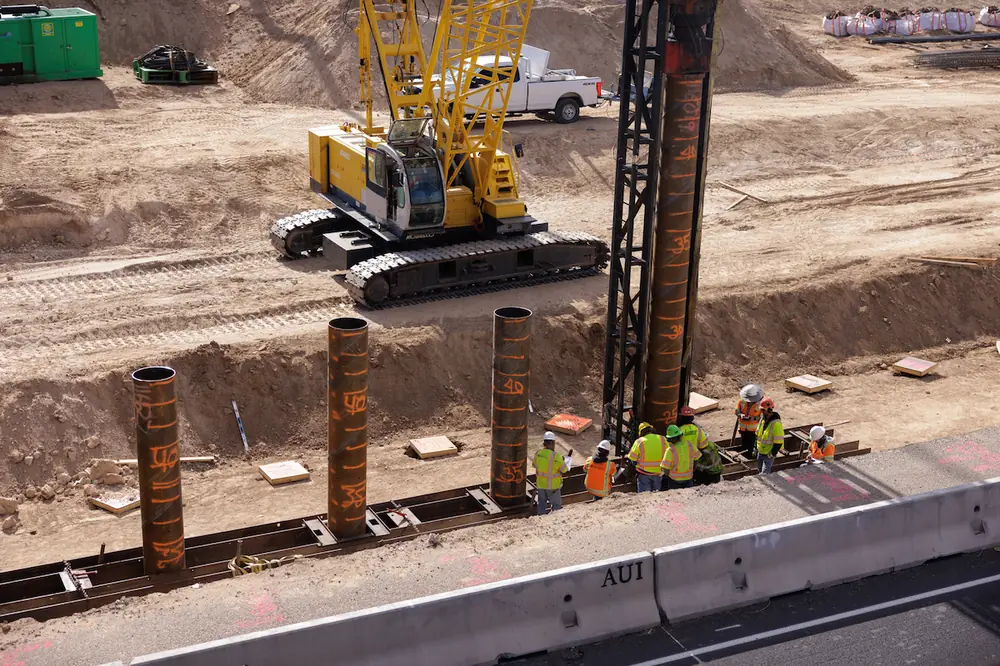
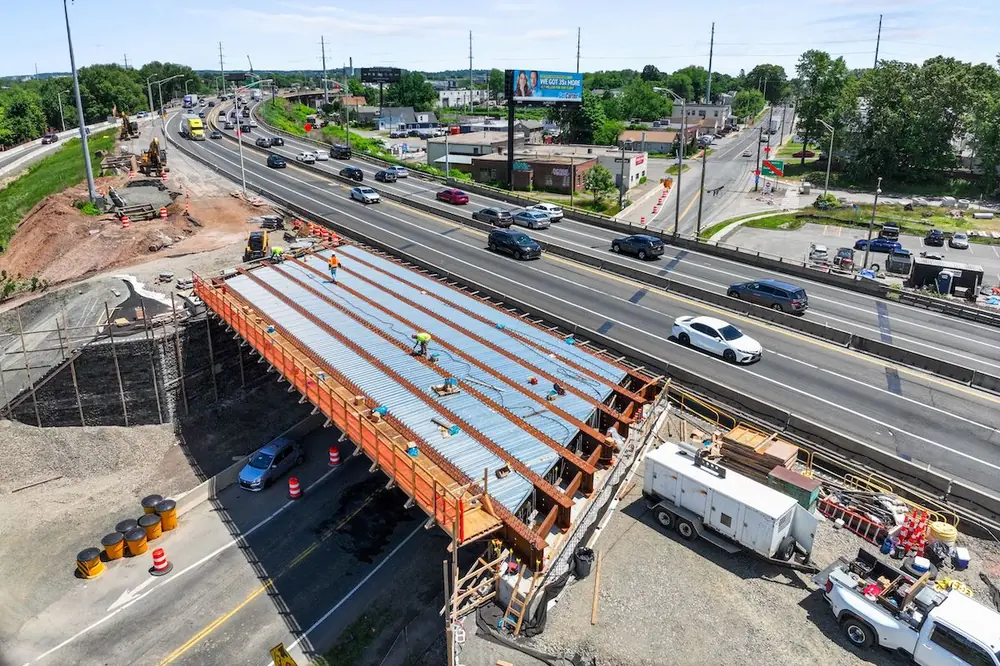
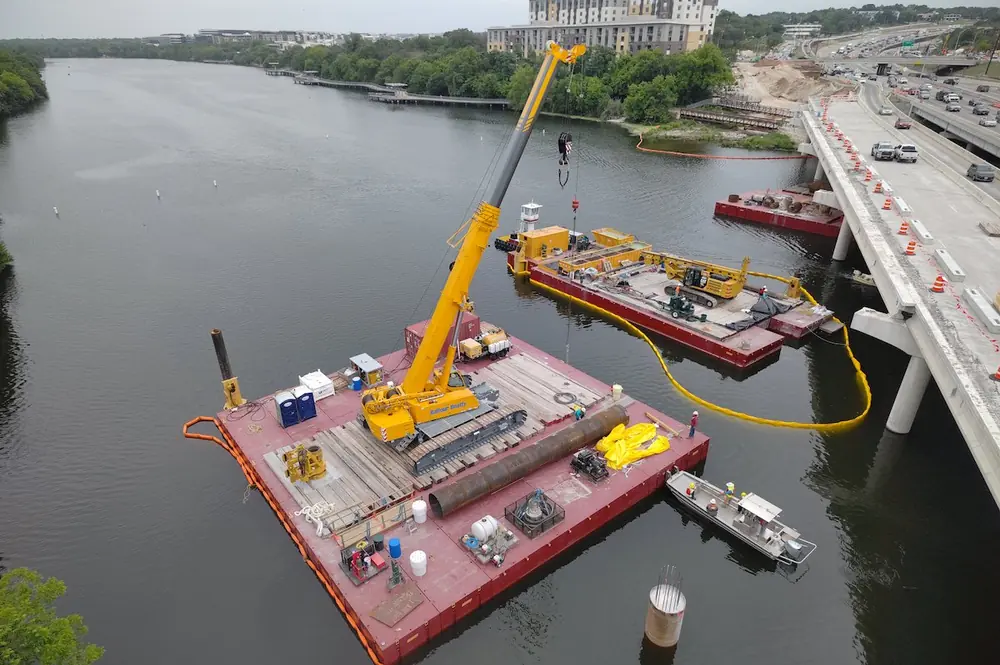
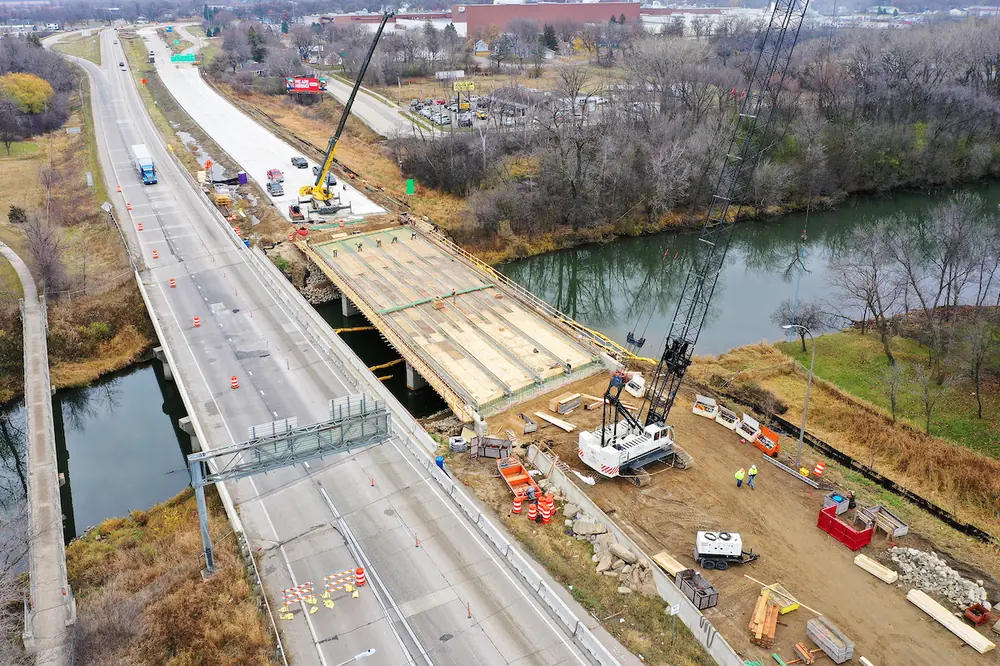
Arizona’s bridges received a B+ grade, the highest grade any state has received for this category and much higher than the national grade of C. Only 1.6 percent of the state’s 8,587 bridges are rated poor, well below the 6.8 percent national average and one of the lowest percentages in the country. Just 163 bridges, or about 1.9 percent of the inventory, are posted with load restrictions. The Arizona Department of Transportation is applying resilience and innovation measures to improve conditions and durability, including Accelerated Bridge Construction, polymer concrete overlays, carbon-fiber strengthening, drones for inspection, and climate and hydrology modeling.

| Your local Gomaco dealer |
|---|
| Gomaco -Contact For a Dealer Near You |
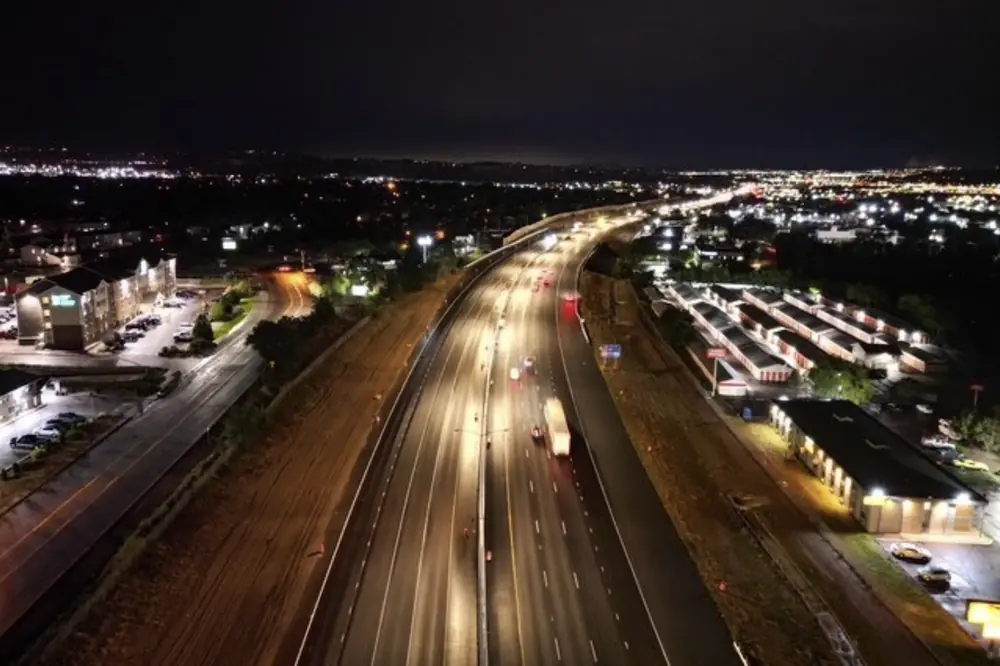
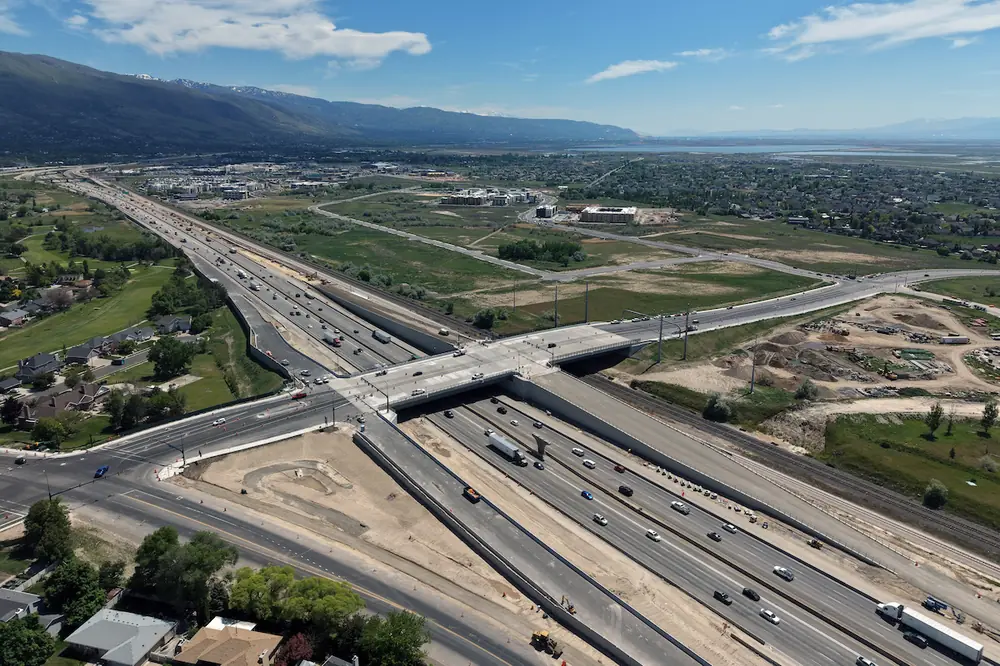
Despite advancements, Arizona has one of the lowest fuel tax rates in the nation at only 19 cents per gallon, leaving a funding gap of roughly $500 million for bridge maintenance projects by 2029. The low fuel tax revenue has led to a much larger maintenance gap for roads (D+), resulting in 54 percent of major roads being rated in poor or mediocre condition. Congestion continues to grow for Arizona drivers, as Phoenix commuters lose an average of 76 hours per year due to congestion and Tucson commuters lose roughly 50 hours per year. Anticipated population gains, much of which is expected to be in the Phoenix-Tucson Sun Corridor, will exacerbate current congestion problems without robust investment and expansion projects.
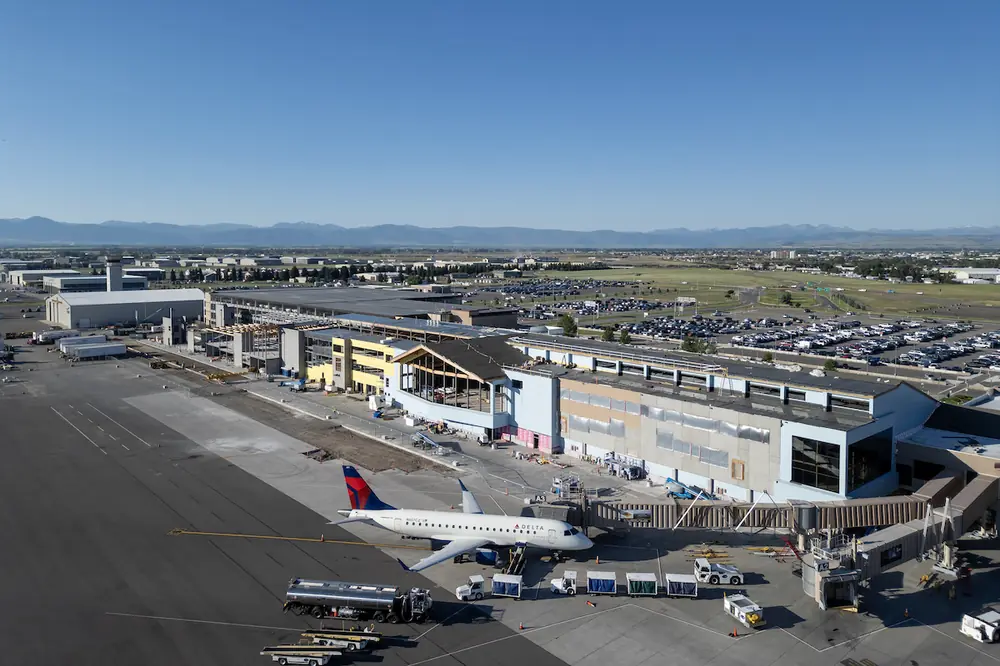
Aviation (B-) and transit (C) grades significantly outperform their national counterparts. The state’s 67 public-use airports are currently meeting capacity demands, and pavement conditions improved substantially from 2018 to 2021. Phoenix Sky Harbor is undergoing major capacity and terminal improvements, including a roughly $4 billion West Terminal project expected to begin construction around 2030. Funding has also increased in recent years, yet Arizona airports still face an estimated $48 million annual shortfall for capacity and maintenance expenses through 2030, with rural airports most affected. Transit service is adequate in most urban regions, and investments like the 5-mile South Central Light Rail Extension are improving connectivity. However, nearly 15 percent of Arizona’s workforce still lacks adequate access to reliable transit, and the state lacks a dedicated transit funding source. Transit agencies rely primarily on federal grants, local sales taxes, fare revenues, and local government contributions to support both capital projects and operations, which can vary in reliability.
While major utilities are successfully managing growth and investing in drinking water (C-) infrastructure, the state faces mounting capacity challenges from Colorado River shortages, accelerating groundwater depletion, rapidly aging infrastructure assets (most of which having been constructed in the 1950s through 1970s), and a population projected to grow from 7.6 million today to 10.5 million by 2050. The Environmental Protection Agency estimates over $12 billion in drinking water infrastructure needs in Arizona over the next 20 years. Arizona’s wastewater (C) network continues to reliably support a rapidly growing population through more than 26,000 miles of sewer pipe and roughly 320 treatment plants, but much of the system is aging, with an estimated 30 to 50 percent of collection infrastructure requiring rehabilitation within the next decade, and at least a dozen treatment plants requiring expansion to meet future demand.