Minnesota has taken steps to make its infrastructure network more sustainable to withstand increasingly severe weather, but additional steps must be taken as the state’s infrastructure is aging. Funding has been limited for systems throughout the state, particularly for surface transportation networks, and local and state funding must be increased to bring these critical systems up to speed. Civil engineers graded aviation (B), bridges (C), dams (C), drinking water (C-), energy (C), parks (B-), ports (C-), roads (D+), transit (C-), and wastewater (C).
“The ASCE report card serves as an important benchmark for where our infrastructure currently stands and lays out how we can make improvements,” said Sen. Sandy Pappas, DFL-St. Paul. “Knowing that these systems play such a crucial role in economic progress and the safety of Minnesotan families, we have made infrastructure a topline issue and must continue to do so to secure a prosperous future here in Minnesota.”
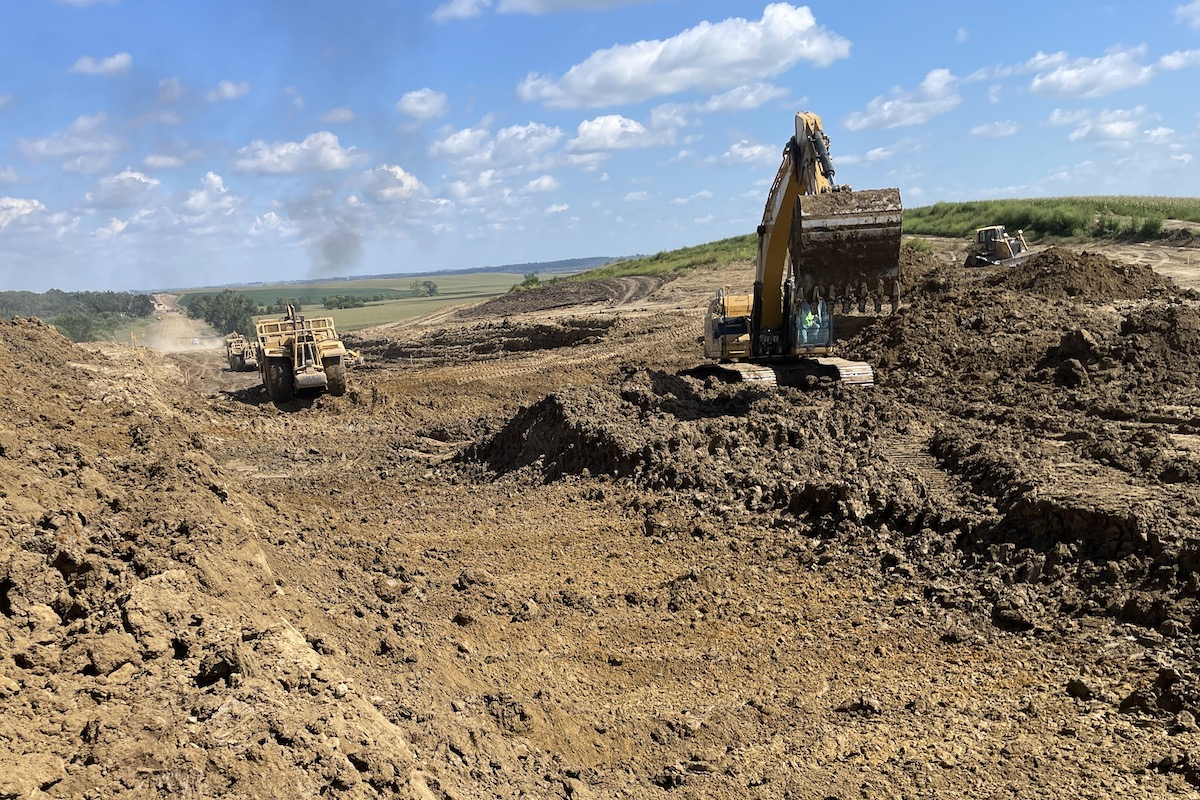
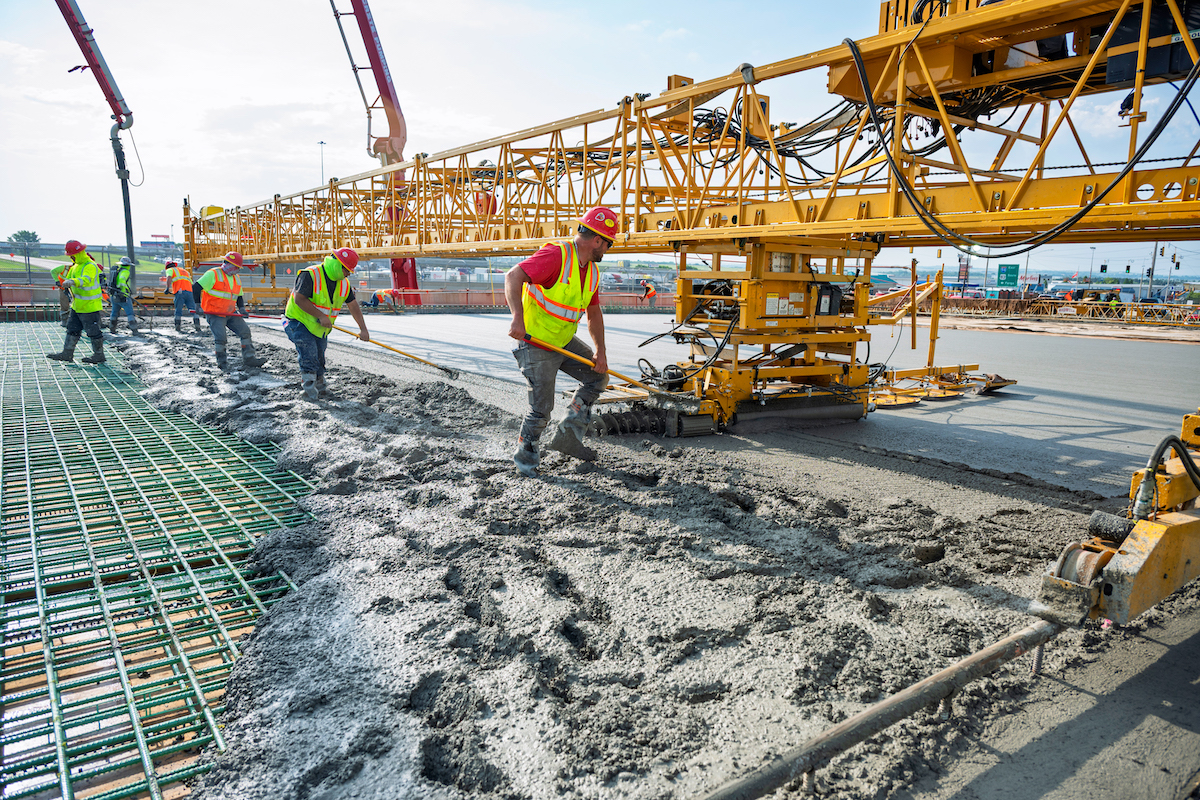
Despite recent investments, Minnesota’s transportation network is severely underfunded. The federal Infrastructure Investment and Jobs Act (IIJA) will help, but local and state funding and financing is necessary to bring the state’s roads (D+), bridges (C), and transit (C-) network up to speed and meet matching requirements to qualify for federal funding.
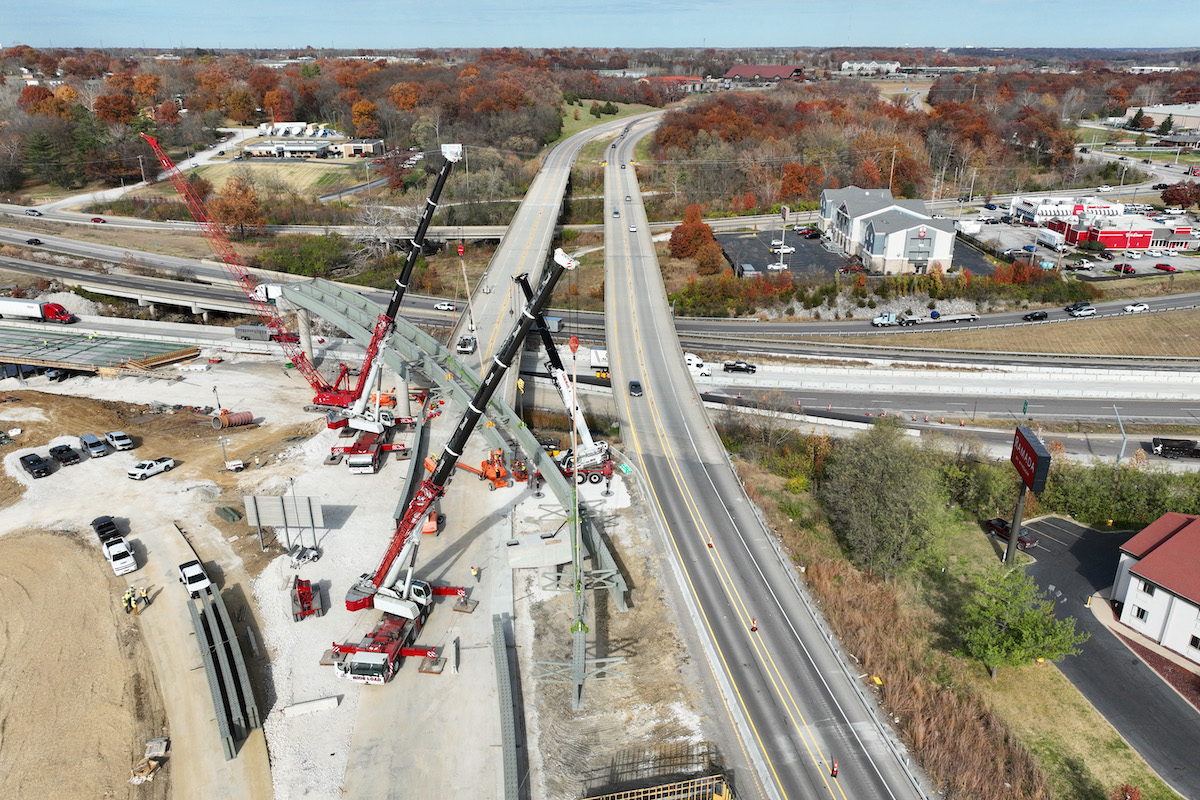
There are 874 bridges in poor condition in Minnesota, a decrease from 1,080 bridges in poor condition in 2017. While this is encouraging, the number of bridges that have slipped from good to fair condition is growing. More than 1,400 bridges are posted with load restrictions, which inhibits economic efficiency. Bridges in Minnesota need $8.2 billion in funding over the next 20 years for identified rehabilitation and repair needs. Current plans include approximately $4 billion in funding, leaving a shortfall of $4.2 billion, or $210 million each year.

| Your local Gomaco dealer |
|---|
| Hayden-Murphy Equipment Co |
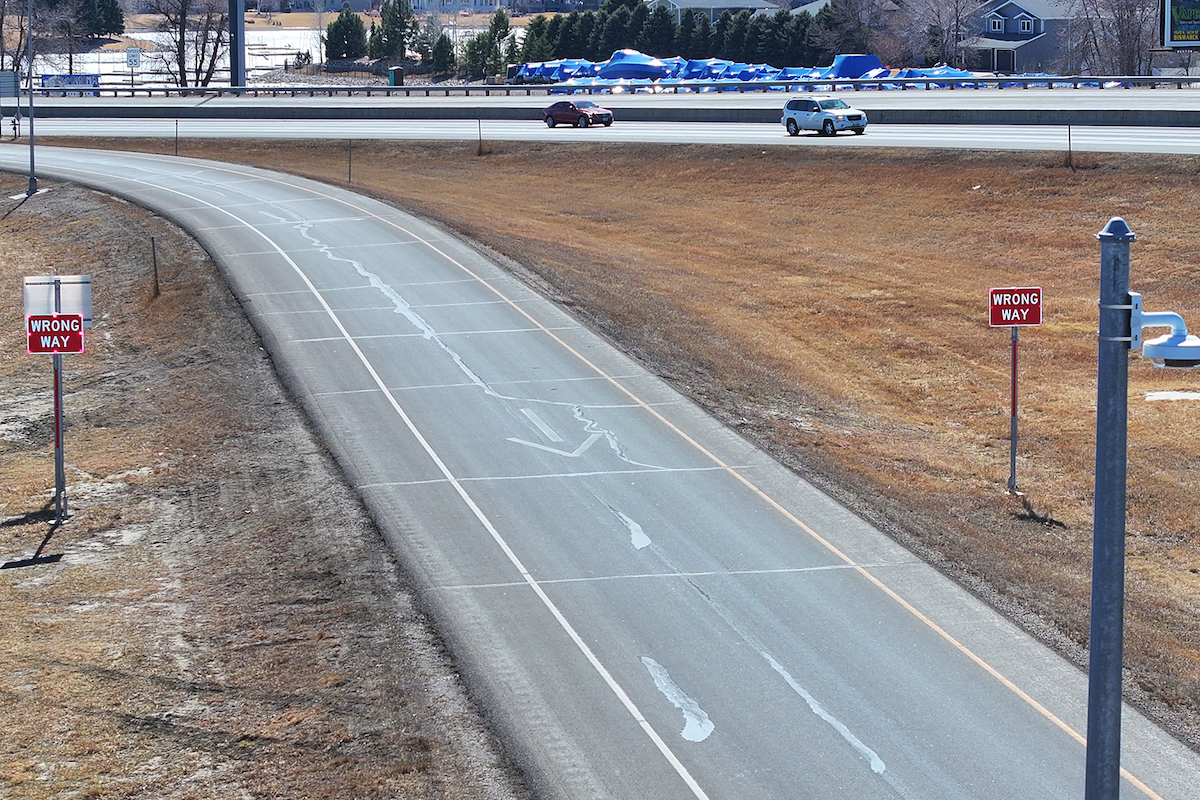
Roads are underfunded by $17.7 billion over the next 20 years, for an annual funding gap of $885 million. Fortunately, the percentage of roadway miles with a ride quality index (RQI) of “good” has seen an upward trajectory over the past 10 years. It has risen from 69.8 percent (2011) to 87 percent (2020) on Interstate miles.
The state’s ports (C-) have sufficient capacity for current and future cargo demands — as the network currently supports movement of 65 to 75 million tons of cargo annually — but facility operators are encountering accelerated freshwater corrosion of steel structures, increased storm frequency and flooding, and dredging backlogs. Existing steel structures are being remediated utilizing unique corrosion remediation methods, but the costs of project requests for these needs are more than double currently available funding.
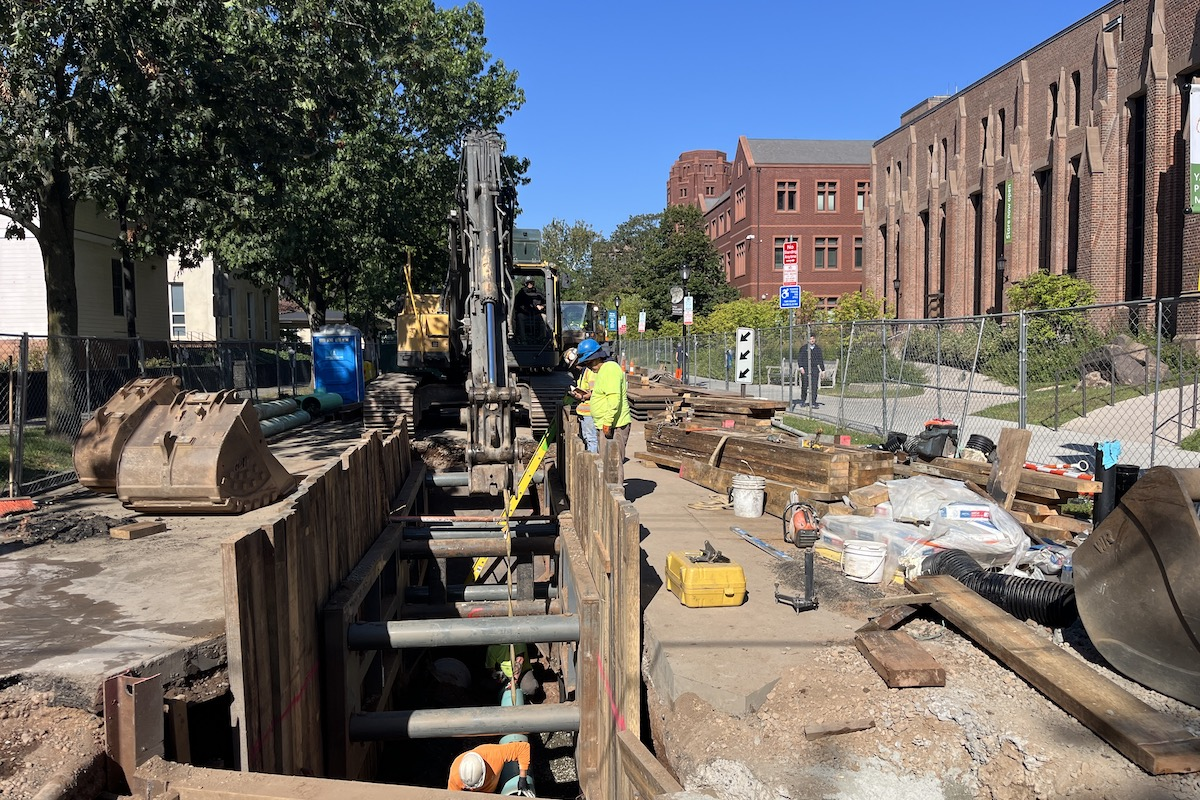
Much of the drinking water (C-) infrastructure in the state is over 50 years old, with some system components being closer to 100 years old and reaching the end of their useful life. Age has a direct correlation with system effectiveness and reliability. As of 2020, Minneapolis averaged approximately 44 prominent water main breaks a year and most pipes involved were over 100 years old. In St. Paul, where the infrastructure is over 100 years old, the city averaged 124 water main breaks along its 1,200 miles of service lines from 2016-2021.
The U.S. Environmental Protection Agency (EPA) estimates the 20-year drinking water infrastructure need for Minnesota is over $7.5 billion. An emerging area of concern is the amount of lead in drinking water, which is caused by lead service lines. In 2020, one community system in Minnesota exceeded the lead action level and 28 exceeded the copper action level; five non-community systems exceeded the lead action level, and six exceeded the copper action level.
“This report illuminates concerns with our infrastructure that sometimes are out-of-sight, out-of-mind, such as the lead pipelines in our drinking water network,” said Katie Zadrozny, Co-Chair, 2022 Report Card for Minnesota’s Infrastructure. “We must prioritize these systems to protect Minnesotan families and businesses because failing to do so can lead to issues we don’t recognize until it’s too late. It is far more cost effective to prioritize maintenance before issues arise.”

| Your local Link Belt dealer |
|---|
| Hayden-Murphy Equipment Co |
Minnesota has begun identifying sustainable solutions for its infrastructure network, as these systems must be prepared to withstand current and future weather events, which are increasing in severity and frequency year after year. However, more long-term funding sources must be identified to support critical projects in the state.
Public parks (B-) are among the greatest draws to the state with St. Paul being ranked No. 2 and Minneapolis No. 3 by the Trust for Public Land’s Park Score in 2021. Nature-based tourism contributes to the $12.5 billion in annual sales that result from overall travel and tourism within the state. However, the state is challenged to maintain basic operations at many state recreation facilities and more and more people are engaging in the outdoors, but funds available for basic maintenance and expansion have not kept pace.
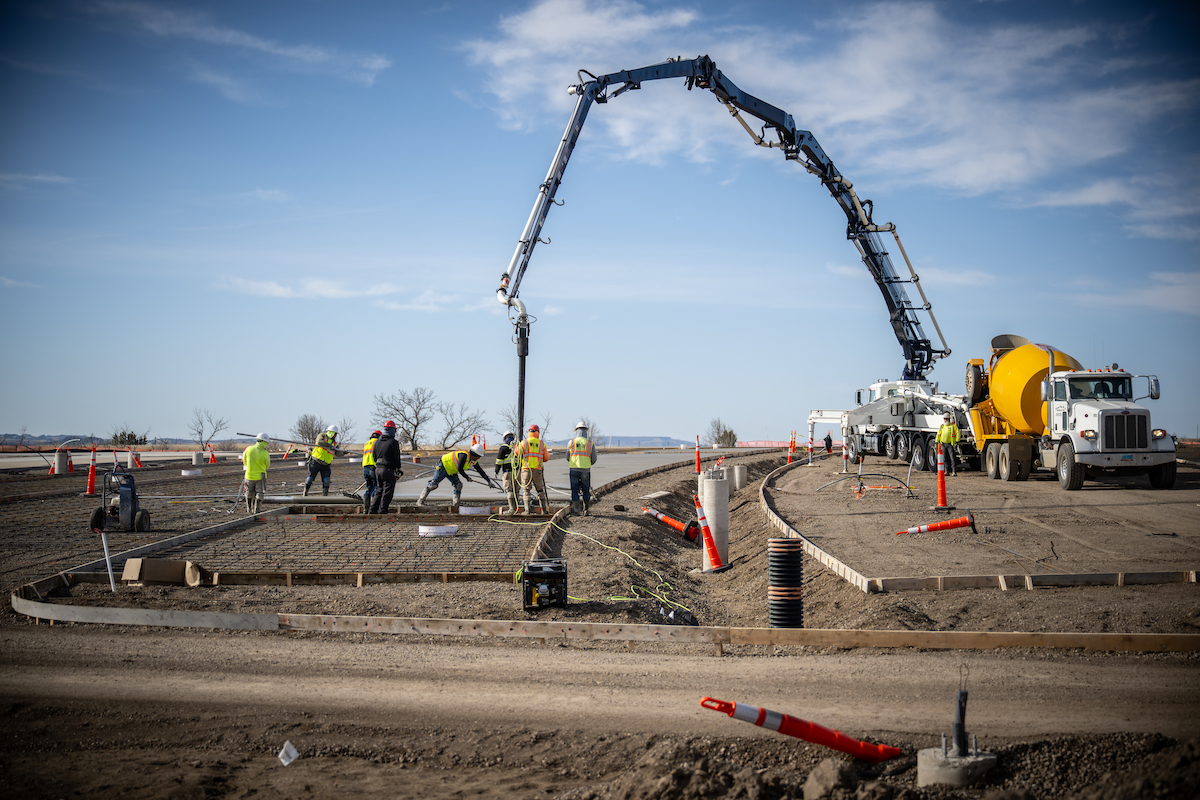
Minnesota’s aviation (B) sector has prioritized sustainability in the past 10 years, particularly among the state’s commercial airports — including Minneapolis-St. Paul (MSP) International Airport, which accounted for 98 percent of passengers in the state in 2019. Examples include the use of geothermal energy, facility retrofits to reduce water and energy consumption, the use of more locally produced and more durable fixtures, green roofs to reduce stormwater runoff, the use of solar power, and the installation of energy-efficient parking ramp lighting. Additionally, MSP has sufficient capacity for current and future needs and runways are in good conditions.
The energy (C) sector has seen major investments in renewable energy. In 2020, 29 percent of Minnesota’s electricity was produced by renewable energy — almost a five-fold increase from 2005 — and puts Minnesota ahead of many other states. However, growth in renewable energy generation must be met with investments in the transmission system, the “interstate highway” of the electric grid. There are two transmission upgrades in the state that will enhance capacity in the system totaling $68 million. Minnesota’s residential electricity rates are increasing to help fund necessary improvements, but rate growth from 2018 to 2021 was still 3.5 percent less than the U.S. average increase.
The report also includes calls to action to raise the grades, including recommending the Minnesota legislature act to maximize available federal dollars through the IIJA by providing the required matching formula funds over the next five years, and encouraging water utilities, municipalities, and other infrastructure owners to consider adopting asset management strategies to stretch available dollars and prioritize needed repairs.

| Your local Komatsu America Corp dealer |
|---|
| Road Machinery and Supplies Company |
The Report Card was created as a public service to citizens and policymakers to inform them of the infrastructure needs in their state. Civil engineers used their expertise and school report card-style letter grades to condense complicated data into an easy-to-understand analysis of Minnesota’s infrastructure network. ASCE State and Regional Infrastructure Report Cards are modeled after the national Infrastructure Report Card, which gave America’s infrastructure an overall grade of ‘C-’ in 2021.


