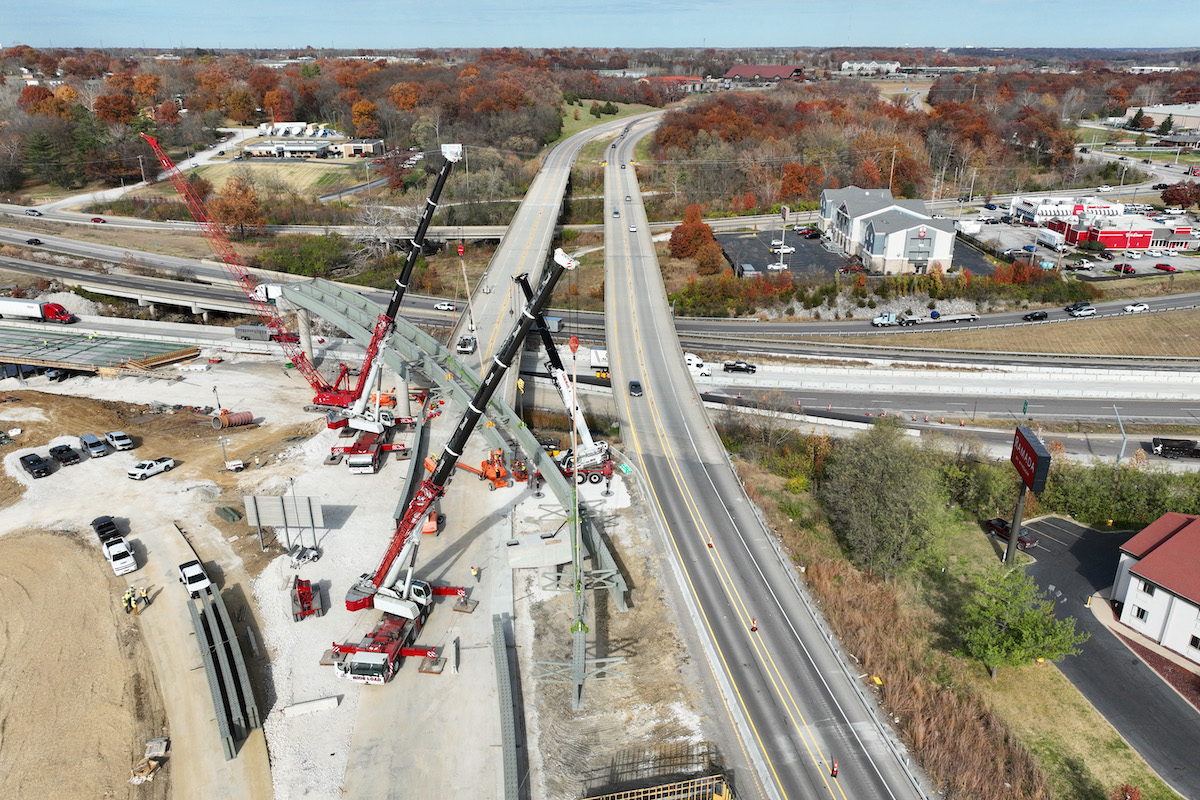
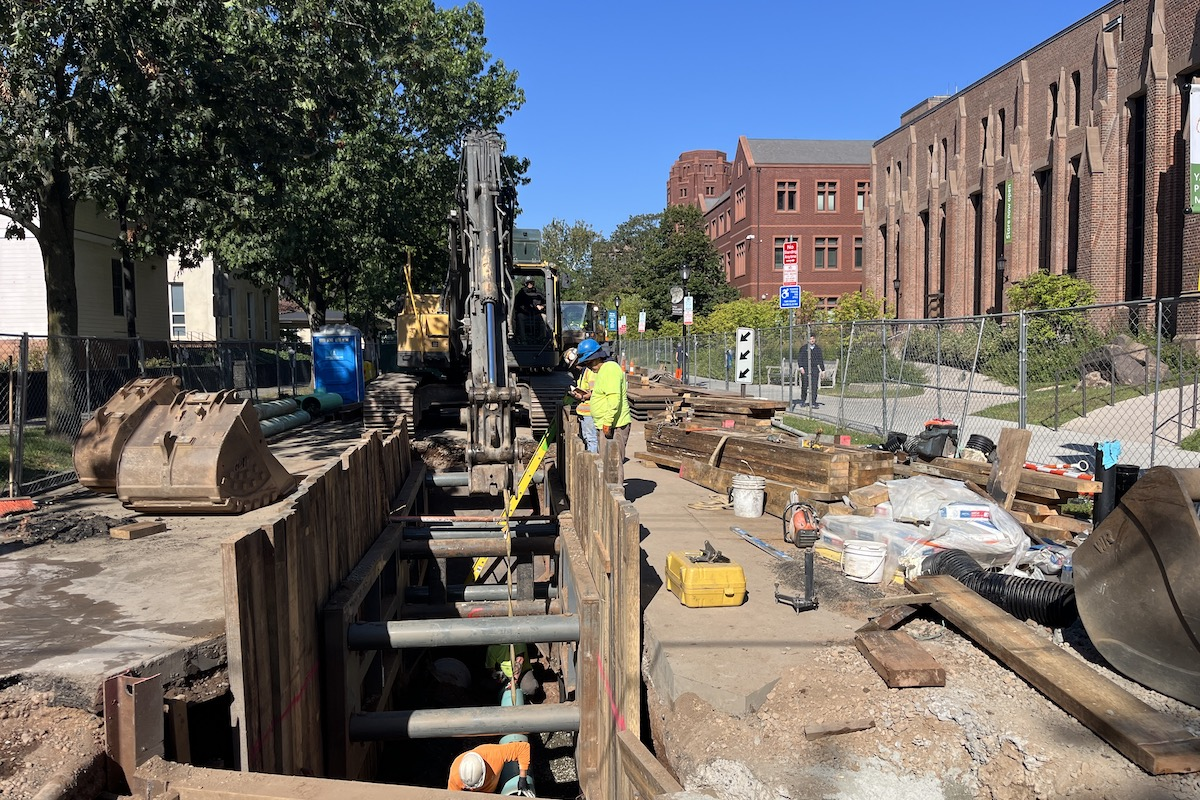
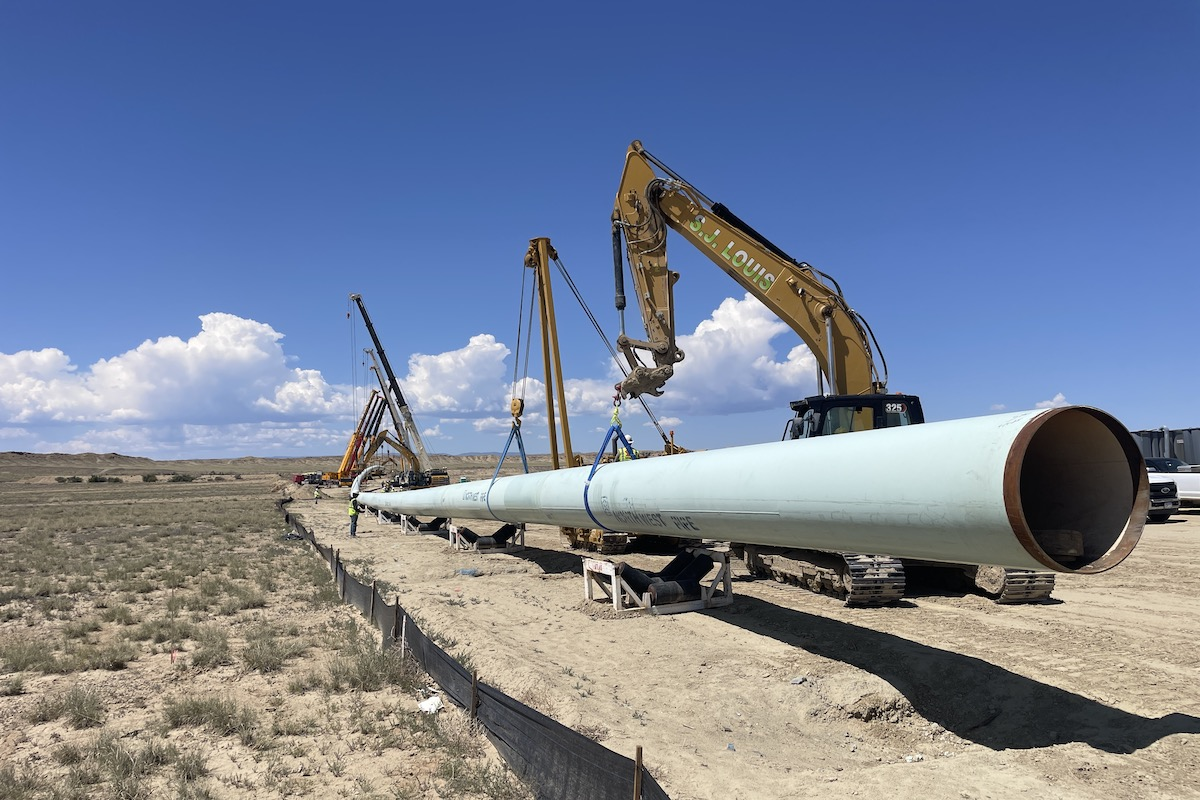
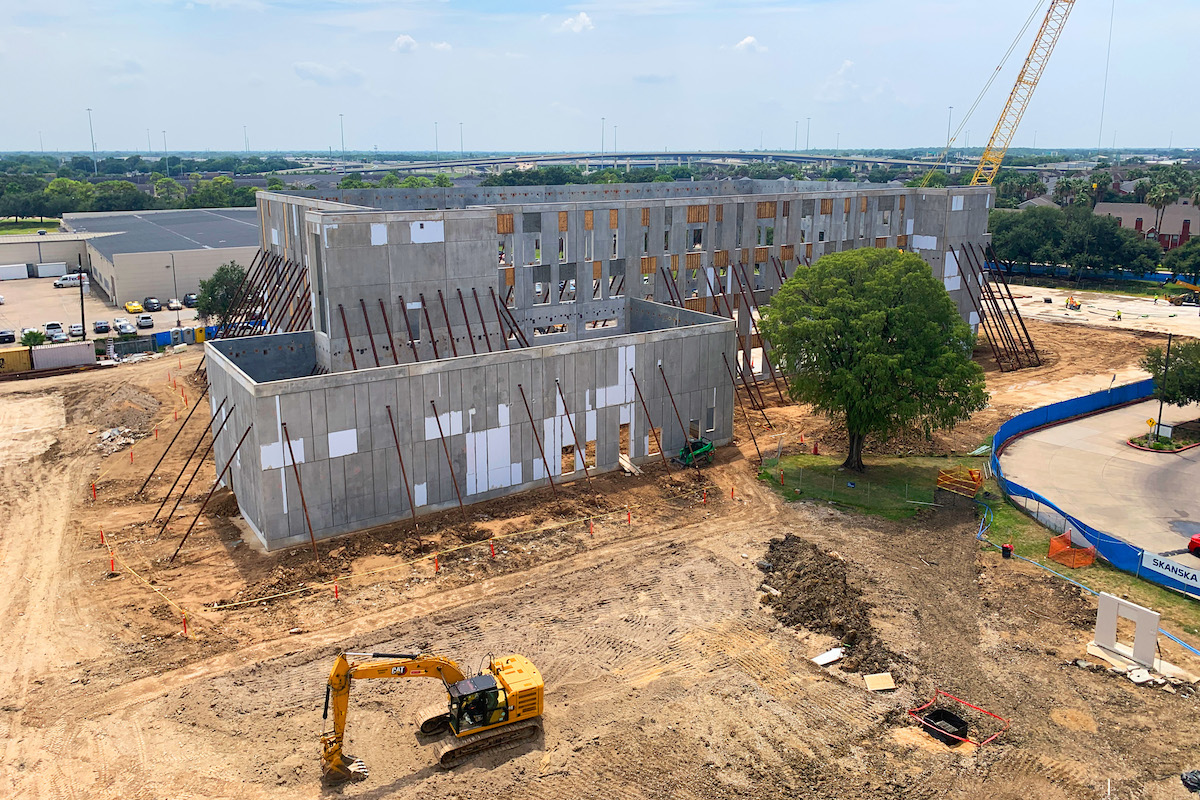
The TRIP report, “Keeping Ohio Mobile: Providing a Modern, Sustainable Transportation System in the Buckeye State,” finds that nearly one-third of Ohio’s major locally- and state-maintained roads are in poor or mediocre condition, 5 percent of locally- and state-maintained bridges (20 feet or more in length) are rated poor/structurally deficient, congested roads cost Ohio drivers $5 billion in lost time and wasted fuel annually, and the state’s traffic fatality rate increased from 2019 to 2022.
Ohio transportation funding received a significant boost in 2019 when the state’s tax per gallon of gasoline was increased by 10.5 cents (to 38.5 cents per gallon) and the state tax on diesel fuel was increased by 19 cents (to 47 cents per gallon). As a result, from 2020 through 2030 nearly $5.4 billion in additional funds will be made available, allowing for needed improvements to the state’s surface transportation network. Ohio transportation funding was further boosted in 2021 by the passage of the Infrastructure Investment and Jobs Act, which has increased federal highway, bridge, and transit funding in Ohio by approximately 30 percent. While this additional transportation investment will allow Ohio to make significant progress on transportation improvements, the Ohio Department of Transportation (ODOT) has identified nearly $1.6 billion in needed projects throughout the state for which construction funding is not yet available. The TRIP report includes a list of local projects throughout the state that will be completed from 2023 to 2026 as a result of additional transportation funding, as well as needed projects for which construction funding is not yet available.
The TRIP report also found that revenue from the state and federal motor fuel tax — a critical source of transportation funding in Ohio — is likely to erode as a result of increasing vehicle fuel efficiency, the increasing use of electric vehicles, and the impact of inflation. During 2022 and the first half of 2023, the Federal Highway Administration’s national highway construction cost index, which measures labor and materials cost, increased by 36 percent.
“As this latest TRIP report demonstrates, ODOT and Ohio’s local governments are doing good things with the enhanced federal funding and the increase now being realized from the 2019 state motor fuel tax increase,” said Chris Runyan, PE, member of the Fix Our Roads Ohio coalition and President of the Ohio Contractors Association. “But it also demonstrates that it is critical to maintain this funding stream to maintain and update Ohio’s highways and bridges for the betterment of the businesses and communities that rely on a well-maintained and efficient transportation system.”

| Your local Bobcat dealer |
|---|
| O'Leary's Contractors Equipment & Supply |
The TRIP report finds that nearly one-third of Ohio’s major locally- and state-maintained roads are deteriorated, with 16 percent in poor condition and 15 percent in mediocre condition. Driving on deteriorated roads costs the average Ohio driver an additional $524 each year in extra vehicle operating costs — a total of $4.2 billion statewide. These costs include accelerated vehicle depreciation, additional repair costs, and increased fuel consumption and tire wear.
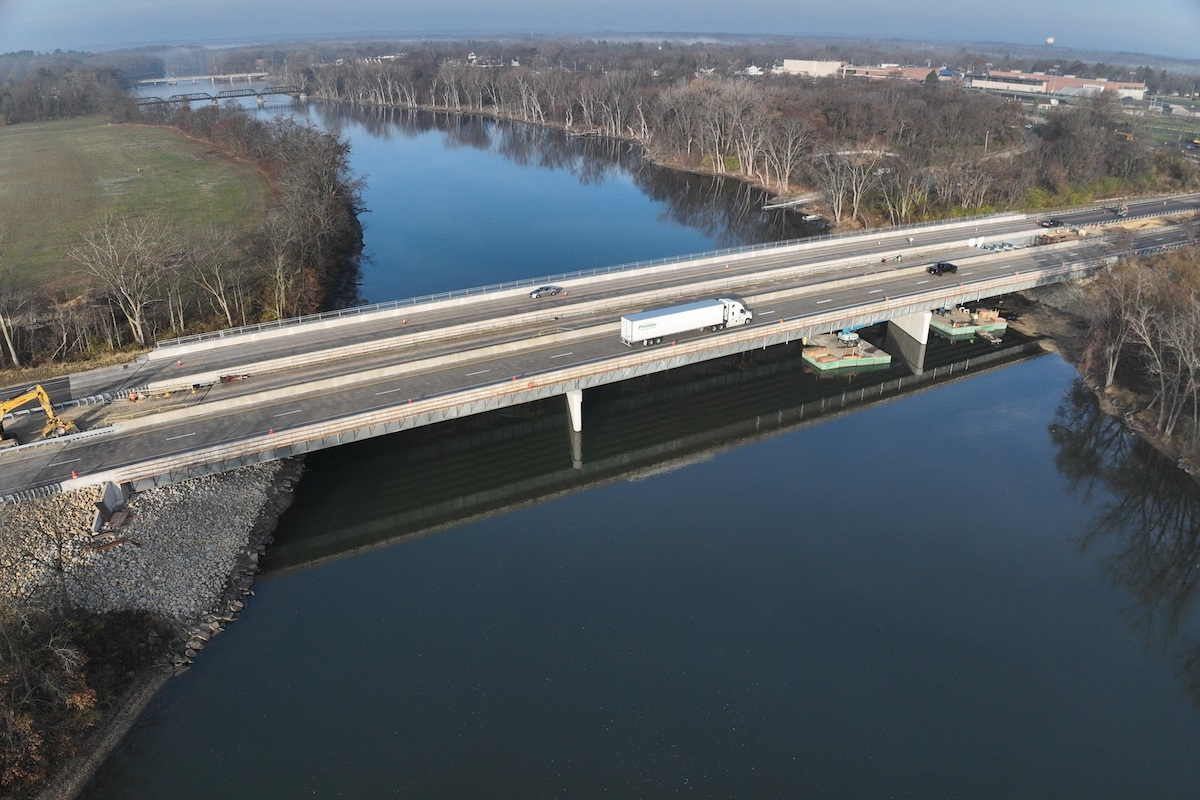
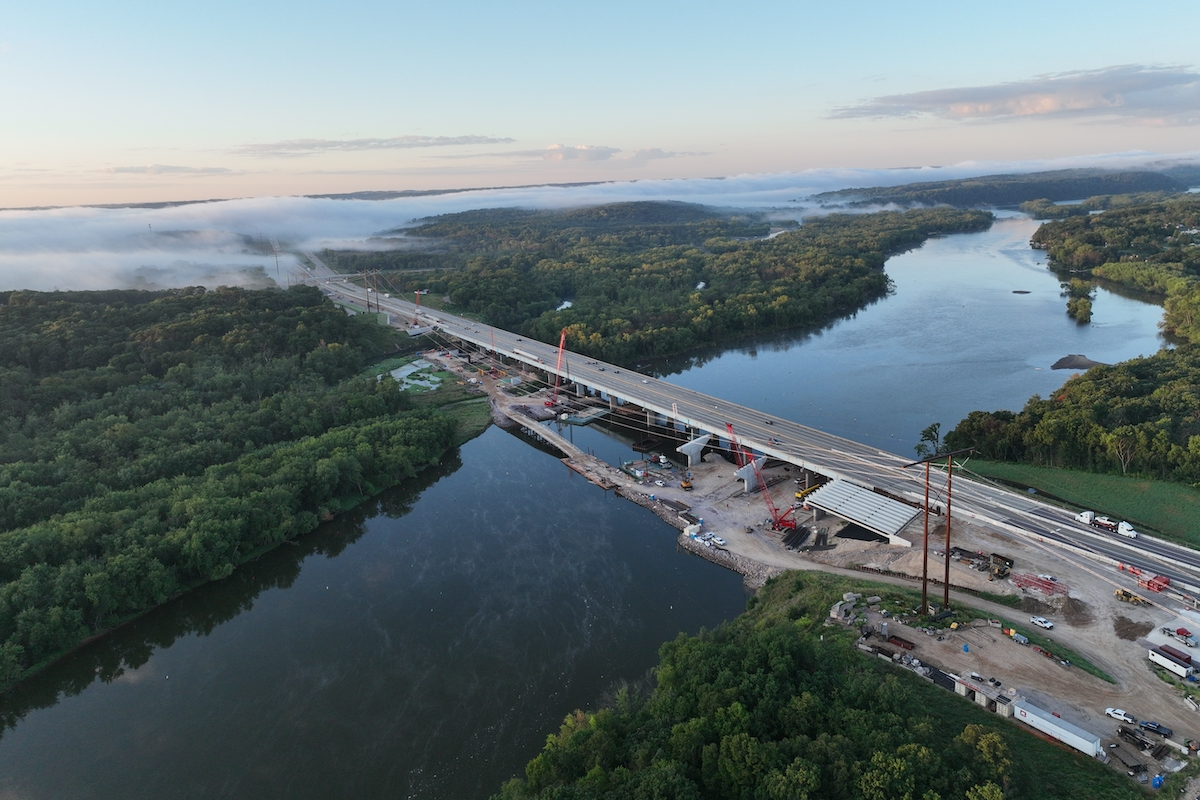
Statewide, 5 percent of Ohio’s bridges are rated poor/structurally deficient, with significant deterioration to the bridge deck, supports, or other major components. Thirty-four percent of the state’s bridges are rated in fair condition, and the remaining 61 percent are in good condition. Most bridges are designed to last 50 years before major overhaul or replacement, although many newer bridges are being designed to last 75 years or longer. In Ohio, 40 percent of the state’s bridges are 50 years old or more.
Congested roads, highways, and bottlenecks choke commuting and commerce and cost Ohio drivers $5 billion each year in the form of lost time and wasted fuel. Traffic congestion causes Ohio drivers to lose as many as 48 hours annually to congestion, wasting up to 24 gallons of gas and losing as much as $1,157 annually in the cost of lost time and wasted fuel. The TRIP report also includes a list of the most congested portions of Ohio highways during a.m. and p.m. peak travel hours and a list of the top 10 truck bottlenecks in the state that cause the longest delays. While vehicle travel in Ohio dropped by as much as 39 percent at the height of the COVID-19 pandemic in April 2020, by 2022, vehicle miles of travel (VMT) in Ohio had rebounded to 4 percent below 2019’s pre-pandemic levels. During the first nine months of 2023, VMT in Ohio was 2 percent higher than the first nine months of 2022, returning Ohio VMT to pre-COVID levels.
From 2018 to 2022, 6,080 people were killed in traffic crashes in Ohio. Nationwide, traffic fatalities began to increase dramatically in 2020 even as vehicle travel rates plummeted due to the COVID-19 pandemic, and the number of fatalities continued to increase in 2021. The number of fatalities in Ohio increased 11 percent from 2019 to 2022, from 1,153 to 1,278, and the state’s fatality rate per 100 million VMT increased from 1.01 to 1.16 during that time. This increase in the number of fatalities and the rate of fatalities per 100 million VMT happened while vehicle travel in the state decreased by 2 percent overall from 2019 to 2022.
“Ohio has put increased state and federal transportation dollars to good use and made needed improvements to its transportation network,” said Dave Kearby, TRIP’s Executive Director. “But, in order to continue to enhance the system, the state will need to make further increases in its level of transportation investment. A safe and reliable transportation network that is maintained in good condition and offers improved mobility and accessibility to meet the needs of Ohio residents, businesses, and tourists alike, is critical to moving Ohio forward."


