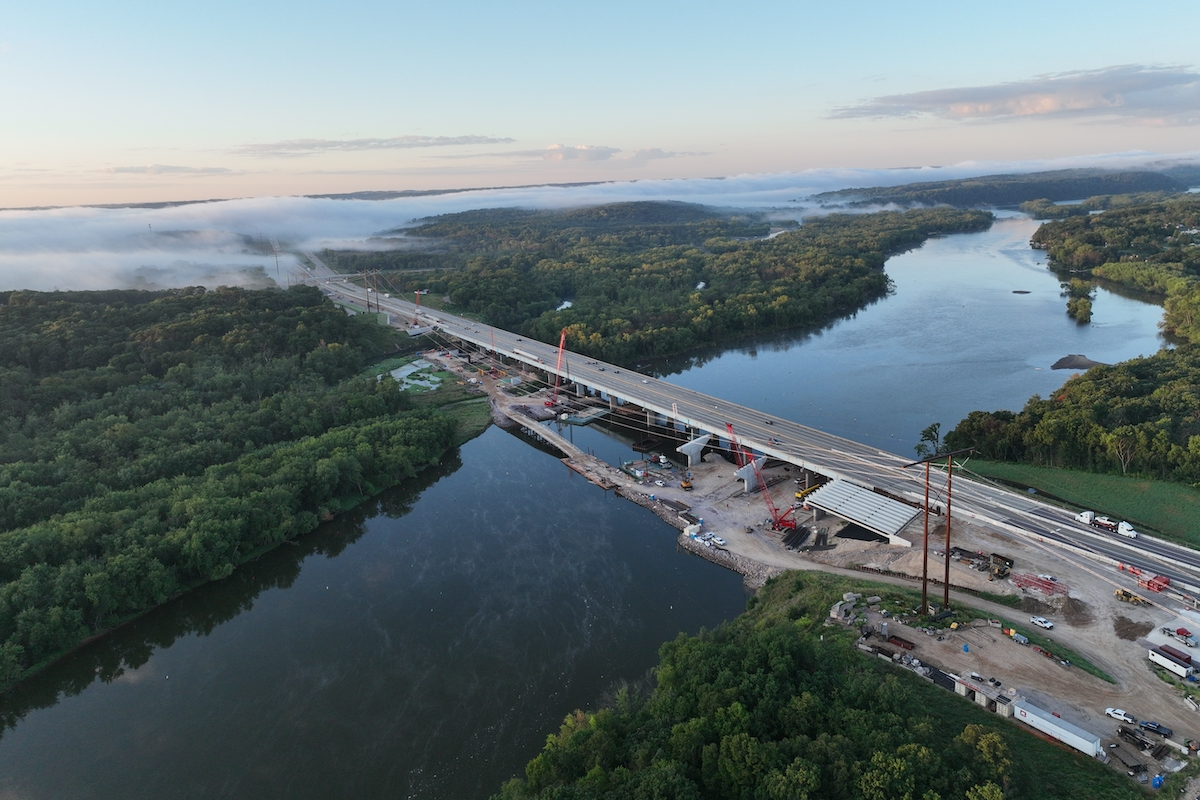
States currently have access to $10.6 billion in Infrastructure Investment and Jobs Act (IIJA) bridge formula funds that could help make needed repairs on these structures, with another $15.9 billion to be available in the next three years.
September 30 marked the end of FY 2023 and states have committed $3.2 billion, or just 30 percent, of available bridge formula funds to 2,060 different bridge projects, with $7.4 billion still coming.
Eight states committed more than two‐thirds of their available bridge formula funds: Idaho (100 percent), Georgia (100 percent), Alabama (97 percent), Arizona (88 percent), Indiana (81.5 percent), Florida (80 percent), Texas (78 percent), and Arkansas (68 percent). There are 31 states, however, that have committed less than 33 percent of available funds, as of June 30.
States have four years to commit formula bridge program funds for specific projects, giving them additional flexibility to decide when to make investments.

| Your local Bobcat dealer |
|---|
| Ditch Witch West |
| Faris Machinery |
Another new IIJA bridge program, known as the Bridge Investment Program (BIP), administered on a discretionary basis by the U.S. DOT, provides an additional $12.5 billion for projects that will be awarded through 2026. The BIP has awarded $2.4 billion for 37 planning small and large bridge project grants in 28 states.
Most bridges are inspected every two years, meaning repairs underway or in the planning stages can take time to be reflected in the NBI data.
In 2023, nearly half of all bridges in the U.S. (48.9 percent) were in fair condition. Bridges in poor condition represent 6.8 percent of the 2023 U.S. bridge inventory – compared to 7.4 percent in 2019.
Based on average cost data submitted by states to the U.S. Department of Transportation, ARTBA estimates it would cost over $319 billion to make all needed repairs.
Bridges are classified in good, fair, or poor condition based on their inspection ratings and definitions from U.S. Department of Transportation.
The definition of “poor” is when a key element of the bridge – the deck, superstructure, substructure or culverts, are rated in poor or worse condition. During inspection, the conditions of a variety of bridge elements are rated on a scale of 0 (failed condition) to 9 (excellent condition). A rating of 4 is considered “poor” condition.
Data on the use of IIJA bridge formula funds is from the U.S. Treasury Department. The data is compiled and analyzed by Dr. Alison Premo Black, ARTBA’s Senior Vice President and Chief Economist. For questions, please contact her at ablack@artba.org.
ARTBA is a non‐partisan federation whose primary goal is to aggressively grow and protect transportation infrastructure investment to meet the public and business demand for safe and efficient travel.
For state‐by‐state and congressional district details visit artbabridgereport.org.
- Over 222,000 spans need repair, including 76,600 bridges that should be replaced.
- This underscores the importance of the new Infrastructure Investment and Jobs Act (IIJA) bridge formula program.
- As the end of FY 2023 approaches, states have only committed $3.2 billion in bridge formula funds, accounting for 30 percent of the $10.6 billion currently available.
- These funds have helped support over 2,060 bridge projects in the construction and repair pipeline.
- Of the bridges needing repair, nearly 42,400 are rated in poor condition and classified as “structurally deficient.” Motorists cross these structures 167 million times a day.
- The number of bridges in poor condition declined by 560 compared to 2022. At the current pace, it would take nearly 75 years to repair them all.
- IH 345 over IH 30 and US 75 Dart Rail, Texas
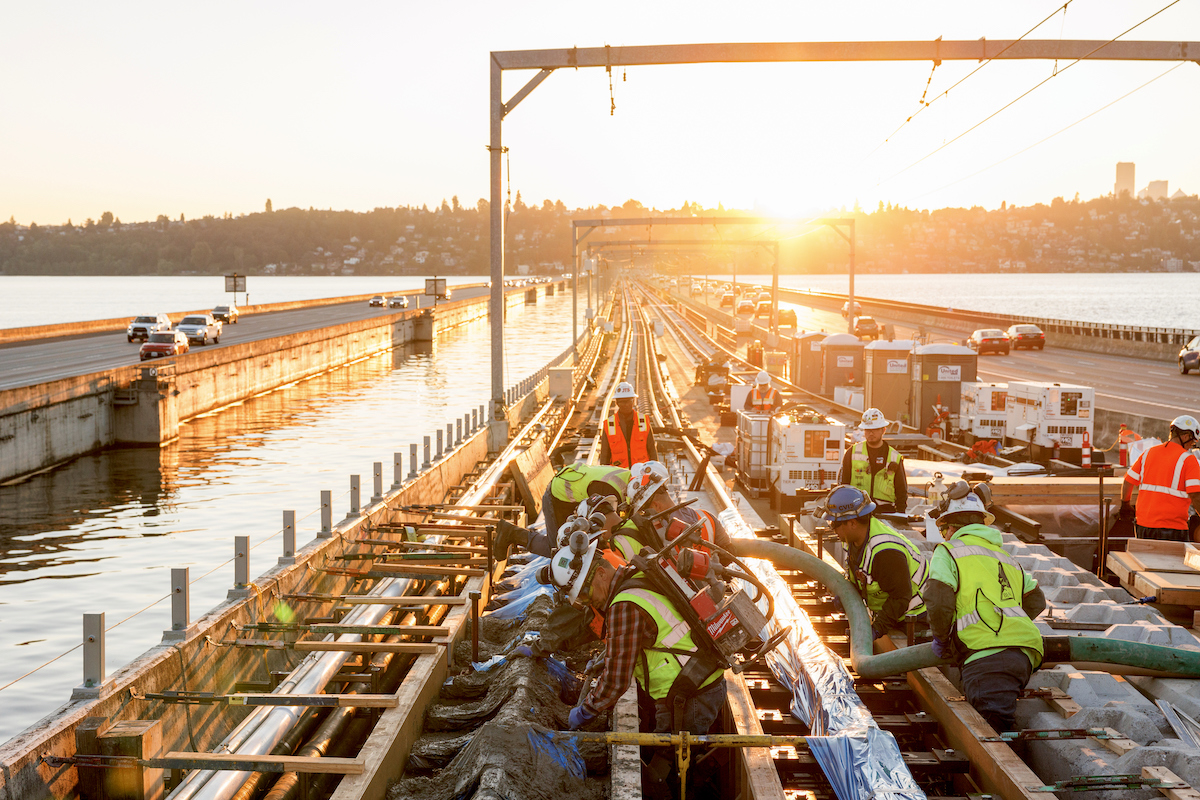
- Lacey V. Murrow Memorial Bridge, Washington
- Route I‐678 over Flushing Bay Promenade, New York
- NC 58 over Intracoastal Waterway, North Carolina
- I‐84 White Salmon over the Columbia River, Oregon
- State Route 51 North Bound in Sacramento, California
- LA 27 over the Intercoastal Waterway, Gibbstown, Louisiana
- US 21 Southbound over Beaufort River, South Carolina
- PR 53 over Grand De Patillas River, Puerto Rico
- SH 146 over Clear Creek and Shipyard Drive, Texas
The bridge classification is based on the latest inspection, which usually occurs once every 24 months for most bridges. Therefore, state and local governments may be in the process of working on some of these structures to make needed repairs.
1. West Virginia (20 percent, #1 in 2022)
2. Iowa (19 percent, #2 in 2022)
3. South Dakota (17 percent, #3 in 2022)
4. Rhode Island (15 percent, #4 in 2022)
5. Maine (15 percent, #5 in 2022)
6. Pennsylvania (13 percent #6 in 2022)
7. Puerto Rico (13 percent, #7 in 2022)
8. Louisiana (12 percent, #8 in 2022)
9. Michigan (11 percent, #9 in 2022)
10. North Dakota (11 percent, #10 in 2022)
States with the largest number of bridges in poor condition, are:
1. Iowa (4,558 bridges, #1 in 2022)
2. Pennsylvania (3,022 bridges, #2 in 2022)
3. Illinois (2,472 bridges, #3 in 2022)
4. Missouri (2,213 bridges, #4 in 2022)
5. Oklahoma (1,815 bridges, #5 in 2022)
6. California (1,591 bridges, #8 in 2022)
7. New York (1,578 bridges, #6 in 2022)
8. Louisiana (1,545 bridges, #7 in 2022)
9. West Virginia (1,442 bridges, #9 in 2022)
10. North Carolina (1,336 bridges, #10 in 2022)
States with the largest deck area in poor condition are:
1. West Virginia (15 percent, #2 in 2022)
2. Rhode Island (15 percent, #1 in 2022)
3. Illinois (11 percent, #3 in 2022)
4. New York (11 percent, #5 in 2022)
5. Massachusetts (11 percent #4 in 2022)
6. Iowa (10 percent, #7 in 2022)
7. South Dakota (10 percent, #8 in 2022)
8. Maine (10 percent, #6 in 2022)
9. Puerto Rico (10 percent, #9 in 2022)
10. Missouri (8 percent, #10 in 2022)


