Helping to lead the charge is the traffic safety industry, which is increasingly leveraging advanced analytics to interpret extensive datasets. By employing predictive modeling and machine learning algorithms, safety experts can accurately forecast potential hazards and implement preventive measures with greater precision and effectiveness. These innovations drive continuous improvement in safety protocols, significantly reducing the risk of accidents and enhancing the overall safety of work zones for both workers and commuters.
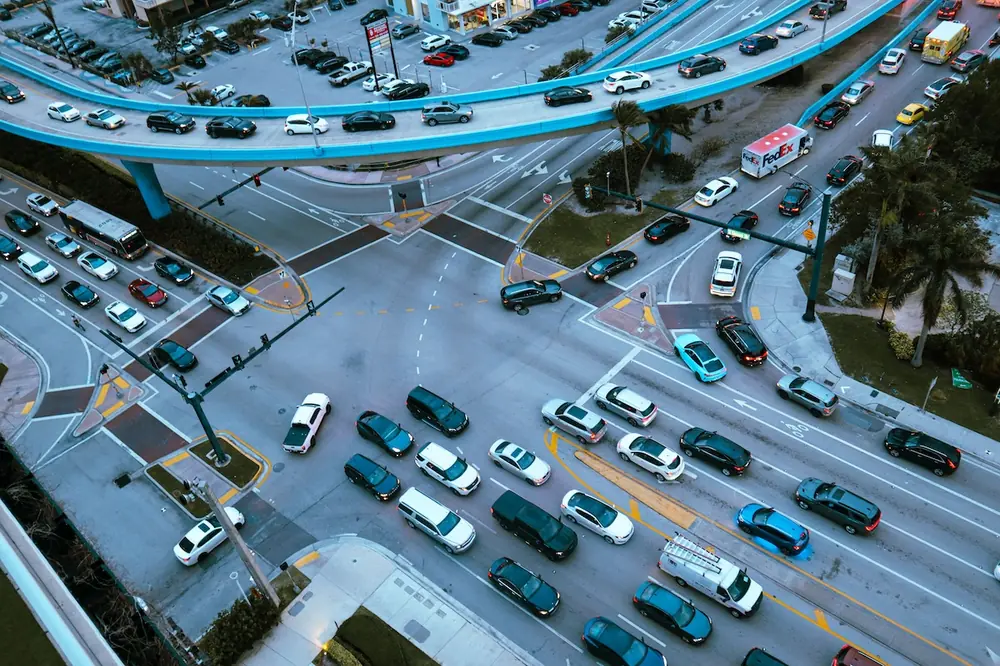
Data analytics additionally integrate traffic flow information, enabling the identification of peak congestion times and areas prone to high volumes. Such data can be particularly revealing; for instance, certain junctions might show a 20 percent increase in reported incidents during rush hour, highlighting inefficiencies in current signal timings.
These data-gathering strategies are enhanced through key practices such as pre-job safety briefings, where input becomes actionable insight; work zone inspections, where regular checkups allow safety managers to identify and mitigate potential hazards; and the stop work authority, empowering employees to halt operations immediately if they identify safety issues in the work zone, which are then recorded.
The specific characteristics of work zones are equally crucial, encompassing details like the length of the zone, the presence of signaling and barriers, and the types of road surfaces involved.
Understanding risks through rigorous analysis allows traffic safety experts to devise targeted interventions. For instance, if the data indicates a higher risk of accidents in work zones near school zones during morning hours, specific measures like enhanced signage, reduced speed limits, and additional road lighting can be implemented during those times.
By synthesizing the information, it becomes possible to identify hazards and contributing factors to accidents within work zones with greater accuracy. Ultimately, the goal of these analytics-driven assessments is not merely to react to accidents but to anticipate and prevent them. This proactive approach ensures a safer environment for all, with the goal of achieving a measurable decline in incident rates and severity.
For motorists, this involves monitoring vehicle speeds, adherence to traffic signs, and reactions to temporary traffic control devices within work zones. Using a combination of traffic cameras, GPS data from vehicles, and sensors placed along roadways, analysts can track how often motorists comply with posted speed limits or follow detour signs. For example, data might reveal that only 70 percent of motorists adhere to the reduced speed limit in a specific work zone, and that compliance drops to 50 percent during overnight hours, suggesting the need for better lighting or more prominent signage.
Similarly, the behavior of workers can be analyzed through data collected via wearable technology that monitors their movements and proximity to hazards. This data may be used to evaluate the effectiveness of safety programs, for example, by comparing accident rates and near-miss incidents before and after training sessions.
Note that critical behaviors must be clearly outlined to ensure safety during the installation, operation, and removal of work zones. This includes specific guidelines on the appropriate gear workers must wear to protect themselves during these activities. Safety committees composed of well-informed, qualified individuals can effectively promote and monitor adherence to these standards.
By analyzing the relationship between compliance with safety protocols and recorded injuries, it is possible to identify practices that are ineffective or areas that may require additional training. For example, if the analysis reveals a recurring pattern of lifting injuries toward the end of shifts, this could suggest that fatigue is a contributing factor, prompting the need for changes in scheduling or the introduction of more frequent breaks.
With a clearer view of work zones and behaviors, targeted interventions can be developed to improve compliance and reduce risk-taking. Often this includes modifying the layout of signage, enhancing the visibility of traffic control devices, and introducing adaptive training programs that focus on identified shortcomings.
The process begins with the aggregation of data collected throughout the project including, but not limited to, incident reports, equipment/device usage logs, worker compliance metrics, and monitoring of environmental conditions.
Safety experts can then perform time-series examination and pattern recognition to determine correlations between specific measures and incident rates. For example, they might analyze the frequency and severity of accidents before and after implementing a new type of barrier or traffic rerouting plan.
Additionally, post-project analyses can include comparative studies where data from the completed project is benchmarked against historical data from similar projects. This helps identify deviations from expected safety outcomes and distinguish the effects of new safety measures from external factors such as weather conditions and traffic volume.
Successful measures can be examined in more detail to understand why they were effective. For instance, if a new signaling system reduced pedestrian incursions into the work zone by 40 percent, analysts would dissect the system’s deployment, from its design and visibility to the training provided to workers on its use.
Conversely, areas for improvement are critically assessed. If data shows that incidents of equipment-related injuries remained constant despite new safety training, a deeper dive into the condition of the equipment and the compliance levels of workers might be necessary.
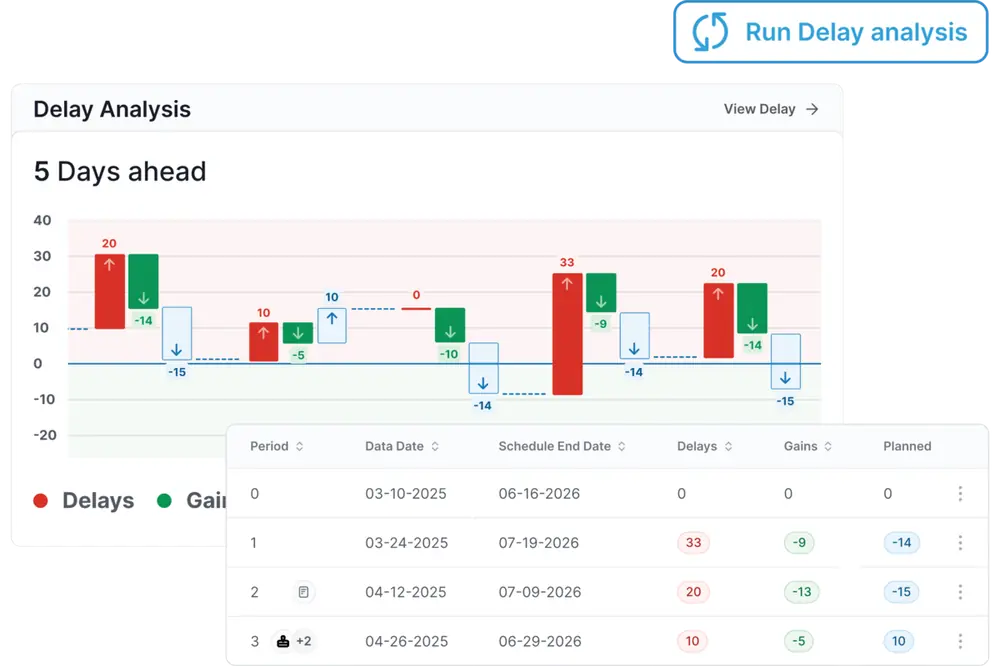
This continuous loop of feedback and improvement is facilitated by detailed data visualizations and reports that communicate findings to all stakeholders, from project managers to safety officers. The ultimate aim is to synthesize these learnings into actionable recommendations that can be implemented in future projects.
Institutionalizing this process ensures that each project contributes to an ever-growing body of knowledge. This repository of data becomes a valuable resource for predictive analytics, allowing future projects to benefit from forecasts and simulations.
As the role of data in safeguarding people and property undoubtedly expands, so does the potential to harness new insights leading to smarter solutions for safer work sites.
Mark Ludewig is the Vice President of Safety for AWP Safety. With over 30 years of experience in environmental, health, and safety management, he leads AWP Safety’s ongoing enterprise initiatives to deliver the safest work zones by leveraging industry data, aligning enterprise with all-encompassing traffic control solutions, and ensuring compliance at all levels.