Overall, the value of work is expected to decline from $294.2 billion in 2020 to $278.1 billion in 2021, according to ARTBA forecast models.
Growth is expected to resume in 2022 as economic conditions improve and travel demand in some sectors begins to return to pre-recession levels. Congressional action in 2021 on a multi-year surface transportation bill – provided it includes a sustainable and robust increase in funding – would be a key factor in helping accelerate recovery in the highway, bridge, and transit construction markets.
Total transportation construction activity – accounting for project costs and inflation – is expected to increase by nearly 4 percent by the end of 2020, with significant gains in highway and street construction (+8.3 percent), subway and light rail work (+8.8 percent), airport terminal and runway construction (+7.2 percent), and port and waterway spending (+12 percent).
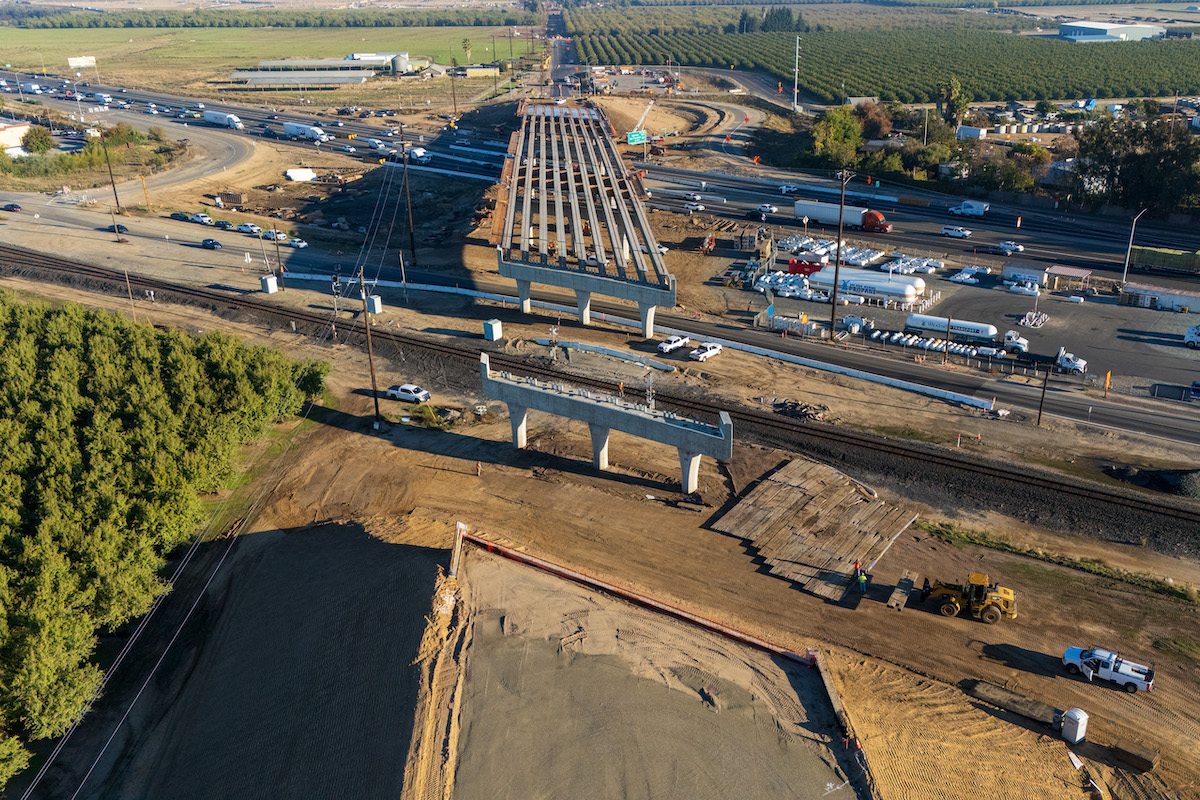
Bridge and tunnel construction activity fell 20 percent in 2020, reflecting several recent market trends. Over the last two years, state and local governments have focused bridge investment on smaller structures. The average size of a bridge contract award in 2019 was down in 32 states compared to 2018. The national average size of a project declined from $3.8 billion in 2017 to $2.5 billion in 2019.
Some programs, such as the Pennsylvania Rapid Bridge Replacement Project, have completed major work. Some states also wait to start major bridge investments when a federal surface transportation law is set to expire. Historically, the share of bridge work has picks up after a new bill is signed into law.
In the current COVID-19 pandemic-driven recession, transportation revenues were directly impacted by stay-at-home orders issued in the spring, high levels of unemployment, a slowdown in economic activity, declines in public transit ridership, and lower demand for air travel and freight shipments. County, city, and local transportation programs that depend on sales tax revenue and state grants to support transportation investment are also facing significant shortfalls. Overall, states anticipate a shortfall in expected transportation revenues of anywhere from $35 billion to $40 billion through 2024.
How this revenue shortfall affects the construction market will vary. The outlook for transportation construction activity, although forecast to decline overall, will be mixed across the country as owners employ different strategies to balance transportation budgets.
Among the differing strategies:
- Delaying projects or cutting capital programs. In 2020, transportation authorities in 18 states delayed at least $12 billion in projects.
- Utilizing bonds, rainy day funds, and other revenue measures to preserve or increase capital spending.
- Reducing operational costs by delaying maintenance projects, furloughing workers, freezing new hires, and cutting other expenses.
There are two major factors that will impact transportation construction activity through 2021 and beyond – the broader economic recovery and the passage of successor legislation to the 2015 Fixing America’s Surface Transportation (FAST) Act.
The first factor is that state and local governments historically have pulled back on transportation investment when facing significant budget pressures. In particular, multi-year recessions can have a lingering impact on highway and bridge programs as state and local revenues decline. After the Great Recession of 2018, it took eight years for the real value of state and local highway and bridge spending to reach pre-recession levels. It took five years for spending to recover after the 1980 double dip recession. At that time spending levels were still down from the 1973 recession, from which it took 13 years to recover.
The one-year funding authorization extension for the FAST Act variable is the reauthorization of expires September 30. Over the last decade, the federal aid program has accounted for over 50 percent of annual state highway program spending, and more than 66 percent of transit capital outlays.
A significant and sustainable increase in federal investment could offset potential program cuts in some states while supporting additional work in states that will continue with projects as planned.
Over the last three fiscal years, Congress has provided a total of $15 billion in supplemental funds for highways, bridges, transit, and airports above the programmed levels in the FAST Act and the Airport Improvement Program (AIP). Funds were provided to states through the formula program, as well as through Better Utilizing Investments to Leverage Development (BUILD) America discretionary grants that can be used for a variety of transportation infrastructure projects.
In 2020, 10 states approved 17 transportation funding measures that will provide at least $6.5 billion in new revenue for transportation projects and support activities. Virginia approved several bills, including a 10-cent increase in the state gas tax and $1.1 billion in bonds for the Hampton Roads Express Lanes project. Bonds measures were also approved in Michigan and Connecticut.
The Maine legislature approved the placement of a $200 million bond measure on the 2020 ballot that was approved by voters in May. An additional $14.1 billion in transportation funding was approved in the 2020 general election, with a record-high 94 percent of measures approved. This included major initiatives in Arkansas ($200 million), Austin, Texas ($7.5 billion), Sonoma County, California ($520 million), and Cobb County, Georgia ($329.9 million). Over 57 percent of the measures approved were property taxes to support local government transportation programs.
The additional federal, state, and local revenue approved in 2020 will help support the market in 2021 and beyond as the new revenue collections are implemented, bonds are issued, and the tax base grows.
It is also expected that some funding measures that were delayed in 2020 will be revisited in the next legislative or election cycle.
Based on recent state and local government contract awards, some of the largest markets expected to show growth are Texas, Virginia, Washington, New Jersey, Indiana, Georgia, Massachusetts, Oklahoma, Louisiana, and South Carolina.
Some states where the value of recent state and local government contract awards are down are Illinois, New York, California, Michigan, Minnesota, Florida, Michigan, and North Carolina. In some cases, the decrease reflects a return to a baseline program level after a large increase in 2019 awards.
While the prices of the individual components for the goods, services, and inputs used for transportation construction fluctuated in the past year, ARTBA estimates that overall project costs were flat in 2020 (compared to 0.9 percent increase for general inflation in 2020).
Overall, the price of various materials and other inputs for highway and bridge construction – excluding energy – rose about 1 percent, according to ARTBA estimates of data from the U.S. Bureau of Labor Statistics. Energy costs for highway and bridge contractors, driven largely by diesel fuel prices, are estimated to have declined 25 percent in 2020. Historically energy costs have been volatile, increasing or falling significantly in a given year.
Industry wages for employees on job sites were up 2 percent in 2020, from $29.08 per hour to $29.50. The average hour earnings for production workers in all construction rose 2.9 percent from $27.63 per hour to $28.44.
The forecast assumes that project cost in 2021 will be up 1 percent, slightly below the expected inflation rate of 1.2 percent. In 2022 and beyond, project costs are expected to increase at 1.9 and 2.2 percent, respectively, the same as the rate of inflation.
By infrastructure mode, forecast highlights include:
The real value of public highway, street, and related work by state DOTs and local governments – the largest market sector – is expected to decline $3.1 billion, or 4 percent, to $74.5 billion in 2021 after growing 8.3 percent in 2020.
- The market will be mixed state-by-state as transportation authorities, state DOTs, and county, city and local governments grapple with budget shortfalls and the broader economic uncertainty.
- The market impact of the $15 billion increase in federal transportation investment through the FY 2018, FY 2019, and FY 2020 appropriations process will vary, depending on the timing of state obligations and the awarding of projects through several U.S. Department of Transportation (DOT) discretionary programs. But overall, this boost will support the market in 2021. At the end of FY 2020, states had obligated 43 percent of the available highway and bridge funds.
- Many states continue to face lower revenue collections from motor fuel taxes and fees and many revenue forecast estimates for FY 2021 and 2022 have been revised downward.
Of the 16 state markets that are $1 billion or more, representing about two-thirds of the market, contract awards were up in seven states last year.
Other key findings:
- Based on recent contract awards data, work is expected to increase in about half the states.
- Some states are continuing to focus on bridge work, but with a greater emphasis on repairs to local, not federal, structures.
- Nationally, bridge work as a share of highway and bridge construction activity has declined steadily from a high of 37.5 percent in 2013 to 22 percent in 2020.
- Missouri approved over $82 million in bonds to support the state’s Local Bridge Replacement Program. Kentucky has a six-year program underway that will repair 1,000 local bridges. Other states include Kansas, West Virginia, Oklahoma, and Iowa.
- Some major markets that are expected to show growth over the next year include Virginia, Texas, Illinois, Indiana, New Jersey, Massachusetts, Oklahoma, Maryland, and Minnesota.
- Investment by private Class 1 freight railroads is expected to remain flat at $13.3 billion.
- Subway and light rail investment is forecast to decline from $11.2 billion in 2020 to $10.9 billion in 2021.
- The Coronavirus Aid, Relief, and Economic Security (CARES) Act, signed into law March 27, 2020, provided $25 billion in emergency relief to help transit agencies cover operating and capital costs. Of that total, $24 billion has been obligated and $12 billion has been spent.
- Congress provided an additional $2.64 billion in supplemental funding for transit through the FY 2018-2020 appropriations bills.
- Transit authorities and local governments are under budget pressures as the number of riders has dropped significantly because of the pandemic. The American Public Transportation Association (APTA) estimates that the number of unlinked transit passenger trips was down over 76 percent in the second quarter of 2020. As a result, many transit agencies have cut service, scaled back operations, and laid off workers. APTA estimates that one-third of transit agencies have delayed capital projects and 20 percent have used capital budgets to cover operating costs.
- Beyond declining demand, local transportation entities dependent on sales tax revenues are also facing budget challenges.
- States that have awarded significant transit and rail contracts in the last year include: Washington, Arizona, Massachusetts, New Jersey, Utah, and Nevada.
- The U.S. DOT’s Capital Investment Grants Program is currently supporting work on the Los Angeles Westside Subway, the San Diego Mid-Coast Corridor Transit Project, the Boston Green Line Extension, the Maryland National Capital Purple Line and the Lynwood Link Extension in Seattle.
- After growing 4 percent in 2020, airport terminal and related work – including structures like parking garages, hangars, air freight terminals and traffic towers – is expected to decrease from $18.9 billion to $15.8 billion.
- Runway work is forecast to decline from $5.7 billion in 2020 to $4.8 billion in 2021.
- Some of the major states with increases in expected runway construction market activity include: Texas, Illinois, Kentucky, Virginia, Massachusetts, and Pennsylvania.
- There are currently 15 major airport expansion projects valued at more than $1 billion that are underway in California, Colorado, Florida, Georgia, Illinois, New York, Pennsylvania, Tennessee, Utah, and Virginia.
- Given the significant decline in air travel demand in 2020, a number of airports are expected to delay major construction work over the next year or reduce the scope of capital projects. This includes work at airports in: Atlanta; Austin, Texas; Charlotte, North Carolina; Dallas/Fort Worth; Des Moines, Iowa; Jacksonville, Florida; Orlando, Florida; Salt Lake City; San Diego; San Francisco; Seattle; and Tampa, Florida.
- States that have increased investments in the past year include: Hawaii, Virginia, Georgia, Maine, Florida and Alaska.
- The passage of the 2018 America’s Water Infrastructure Act (WRDA) provides federal funding for water infrastructure projects over two years. The U.S. Army Corps of Engineers (USACE) plans to spend over $1.6 billion on inland waterway construction projects in FY 2021, supporting work in 15 states.
The full ARTBA 2021 Forecast is available at artba.org


