
SACRAMENTO, CA — While additional state and federal transportation funding is allowing California to repair and improve roads and bridges, a new report documents looming challenges including population growth, rising congestion, construction cost inflation, and declining fuel-tax revenue. The report by TRIP, a national transportation research nonprofit based in Washington, D.C., examines California’s road and bridge conditions, congestion and reliability, highway safety, economic development, vehicle travel trends, and the impact of recent state and federal transportation funding increases.
The TRIP report, “Keeping California Mobile: Providing a Modern, Sustainable Transportation System in the Golden State,” finds that throughout the state, traffic fatalities have increased significantly in the last decade despite recent downward trends, 50 percent of major roads are in poor or mediocre condition, 5 percent of locally and state-maintained bridges (20 feet or more in length) are rated poor/structurally deficient, and traffic congestion costs the state’s drivers $55 billion annually in lost time and wasted fuel. In addition to statewide data, the TRIP report includes regional pavement and bridge conditions, congestion data, highway safety data, and cost breakdowns for the Los Angeles, Riverside-San Bernardino, Sacramento, San Diego, San Francisco-Oakland, and San Jose urban areas of California.
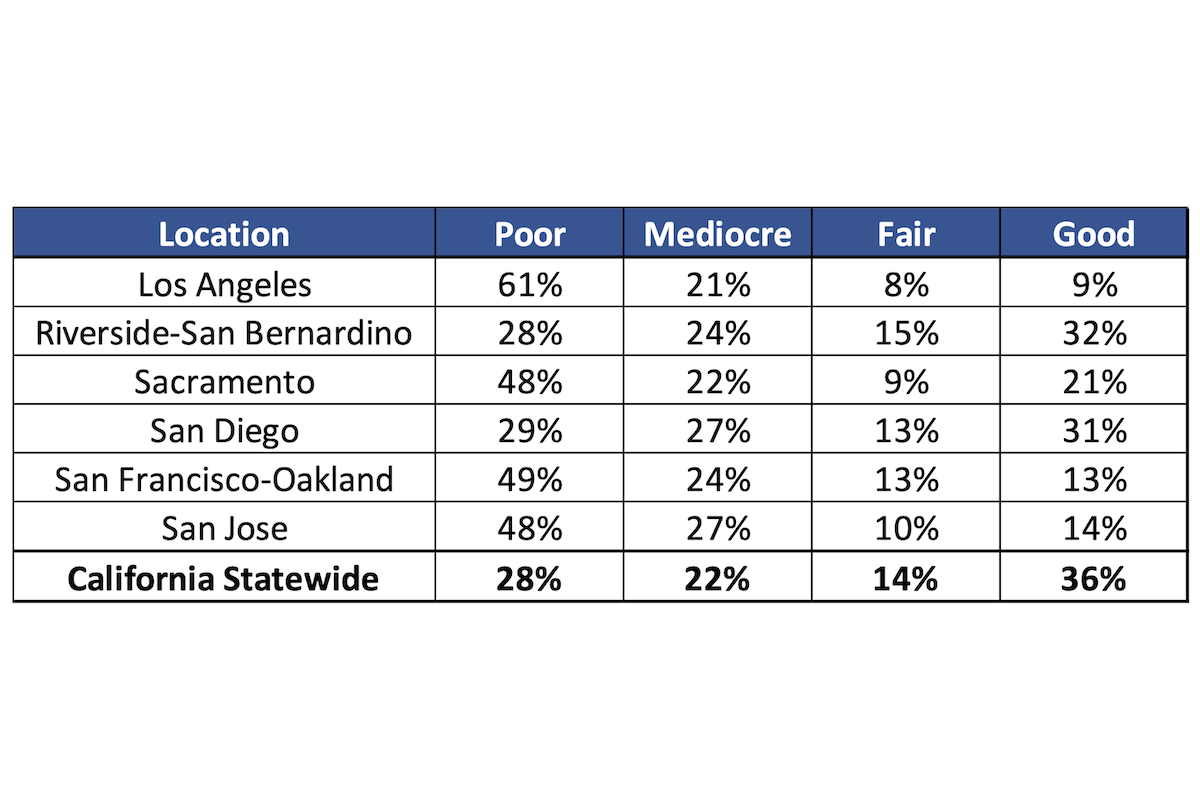
The TRIP report finds that 28 percent of California’s major roads are in poor condition and 22 percent are in mediocre condition. Driving on deteriorated roads costs the state’s drivers a total of $24.2 billion each year in extra vehicle operating costs, including accelerated vehicle depreciation, additional repair costs, and increased fuel consumption and tire wear — an average of $878 per motorist.
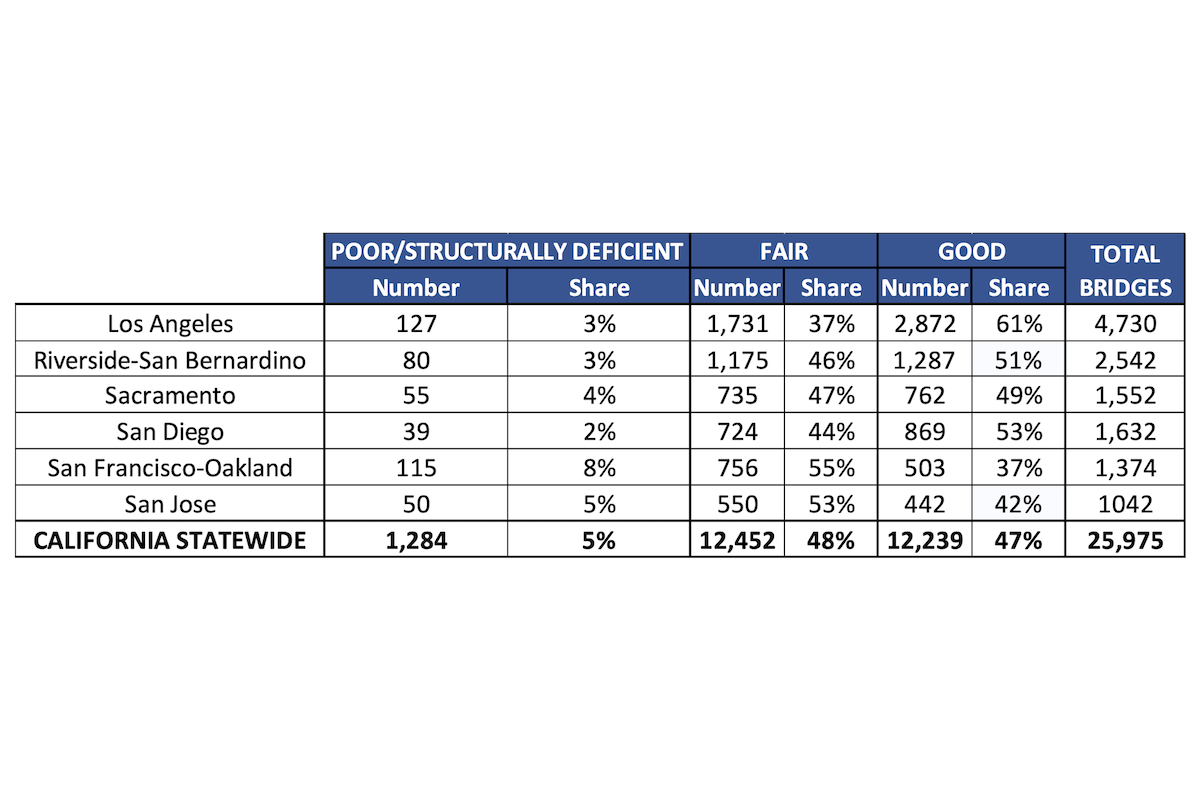
Five percent (1,284 of 25,975) of California’s bridges are rated in poor/structurally deficient condition, with significant deterioration of the bridge deck, supports, or other major components. Forty-eight percent of the state’s bridges are rated in fair condition and the remaining 47 percent are in good condition. This includes locally and state-maintained bridges that are 20 feet or longer. Most bridges are designed to last 50 years before major overhaul or replacement. In California, 54 percent of the state’s bridges were built in 1969 or earlier.
Statewide, drivers lose $55 billion annually because of lost time and wasted fuel due to traffic congestion — as much as $3,478 per driver in the most congested areas. Due to the COVID-19 pandemic, vehicle travel in California dropped by as much as 41 percent in April 2020 (as compared to vehicle travel during the same month the previous year). By 2025, vehicle miles of travel in California had rebounded to 5 percent below 2019’s pre-pandemic levels. Congestion reduces job accessibility significantly. In California’s six largest metros, the number of jobs accessible within a 40-minute drive during peak hours were reduced by 44 percent in 2023 as a result of traffic congestion.

| Your local Trimble Construction Division dealer |
|---|
| SITECH Southwest |
| SITECH West |
| SITECH Southwest |
| SITECH West |
| SITECH Southwest |
| SITECH West |
| SITECH Southwest |
| SITECH West |
Traffic crashes in California claimed the lives of 24,508 people from 2019 to 2024. The state’s 2024 traffic fatality rate of 1.19 fatalities for every 100 million miles traveled was slightly lower than the national average of 1.2. The number of traffic fatalities and the fatality rate per 100 million vehicle miles of travel in California spiked dramatically in 2020 and 2021 before falling each year from 2022 to 2024. But, despite recent progress, from 2014 to 2024 the number of traffic fatalities in California increased 24 percent and the state’s traffic fatality rate increased 29 percent. From 2019 to 2023, 30 percent of those killed in California crashes involving motorized vehicles were pedestrians or bicyclists (5,522 of 20,812).
“California’s future depends on transportation infrastructure that can withstand the challenges of a changing climate and a growing population,” said Senator Dave Cortese, Chair of the California Senate Transportation Committee. “These investments don’t just move people and goods; they cut emissions, strengthen communities, create jobs, and spur economic growth. The TRIP report makes clear that smart infrastructure investments are among the most powerful tools we have to support California’s workforce and drive long-term economic prosperity.”
Improvements to California’s roads, highways, and bridges are funded by local, state, and federal governments. In April 2017, the California legislature enacted SB 1 — the Road Repair and Accountability Act. SB 1 increased state revenues for transportation by increasing the state’s gasoline and diesel taxes, implementing a transportation investment fee on vehicles, and initiating an annual fee on zero emission vehicles. SB 1 is estimated to increase state revenues for California’s transportation system by an average of $5.2 billion annually through to 2027. In addition to state transportation funding, the Infrastructure Investment and Jobs Act, signed into law on November 2021, provides $25.3 billion in federal funds to the state for highway and bridge investments in California over five years, representing a 29 percent increase in annual federal funding for roads and bridges in the state over the previous federal surface transportation program. The IIJA is set to expire on September 30, 2026.
The ability of revenue from California’s motor fuel tax — a critical source of state transportation funds — to keep pace with the state’s future transportation needs is likely to erode as a result of increasing vehicle fuel efficiency, the increasing use of electric vehicles, and inflation in highway construction costs. The Federal Highway Administration’s national highway construction cost index, which measures labor and materials cost, increased by 48 percent from the beginning of 2022 through the fourth quarter of 2024.

| Your local Gomaco dealer |
|---|
| Terry Equipment |
| Terry Equipment |
| Terry Equipment |
| Terry Equipment |
The California Legislative Analyst’s Office found that steps taken by California to reduce greenhouse gas emissions — including programs and policies that are targeted at increasing the adoption of zero-emission vehicles, increasing the use of lower-carbon fuels, and reducing the number of vehicle miles traveled — will reduce state transportation revenues by $4.4 billion over the next decade. This reduction in state transportation spending is projected to result in poorer road conditions. However, the recent federal rollbacks to California strict emissions requirements will impact these programs and policies.
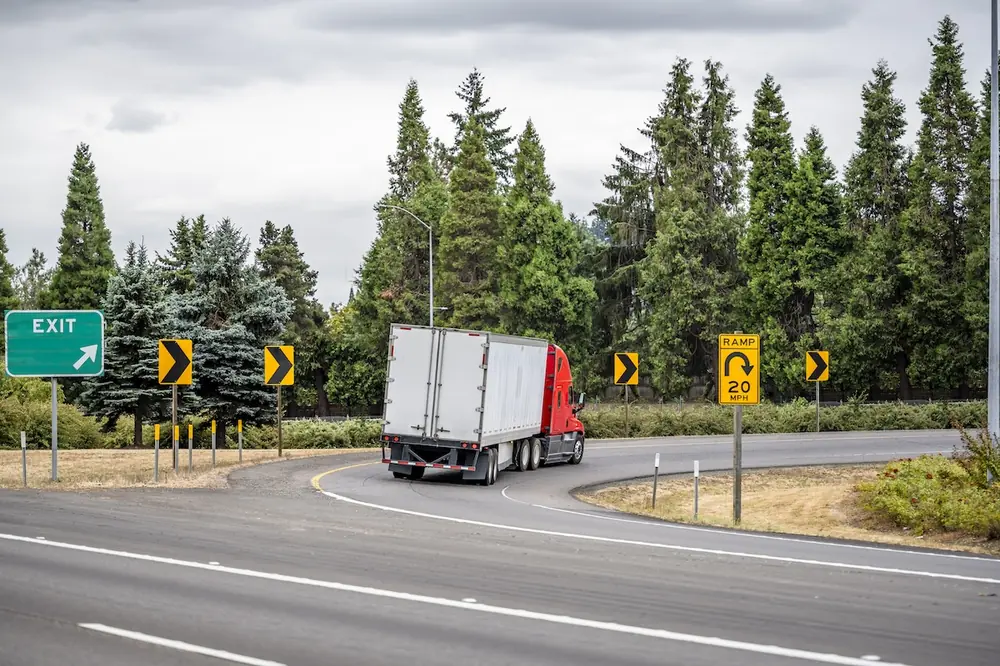
The efficiency and condition of California’s transportation system, particularly its highways, is critical to the health of the state’s economy. In 2023, California’s freight system moved 1.4 billion tons of freight, valued at $2.8 trillion. From 2022 to 2050, freight moved annually in California by trucks is expected to increase 65 percent by weight and 100 percent by value (inflation-adjusted dollars). The design, construction, and maintenance of transportation infrastructure in California supports approximately 420,000 full-time jobs across all sectors of the state economy. Approximately 7.1 million full-time jobs in California in key industries like tourism, retail sales, agriculture, and manufacturing are dependent on the quality, safety, and reliability of the state’s transportation infrastructure network.
“California’s transportation dollars are already being stretched thin by increased inflation in construction costs and declining fuel tax revenue,” said Dave Kearby, TRIP’s Executive Director. “Without additional transportation investment, needed projects that would make the state’s roads safer, smoother, and more efficient will not move forward.”