That information comes from “Bridging the Gap,” a report from the American Society of Civil Engineers (ASCE).
The report analyzed two possible scenarios over 10- and 20-year time frames: one in which recent federal spending levels remain in place, referred to as the “Continuing to Act” scenario, and the other in which federal infrastructure investment returns to pre-IIJA levels when the bills expire in 2026, referred to as the “Snapback” scenario.
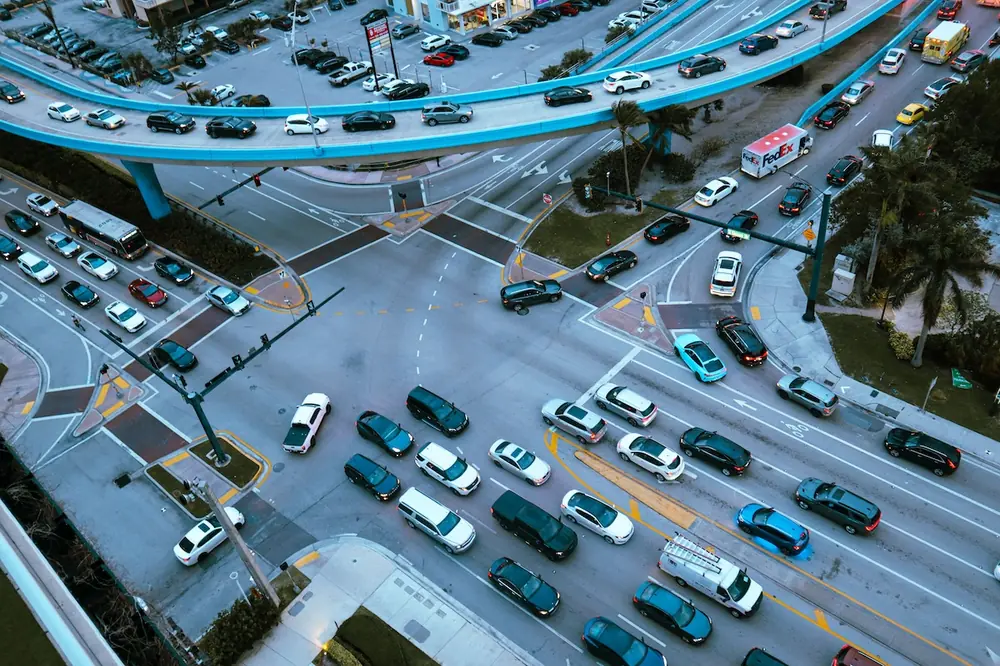
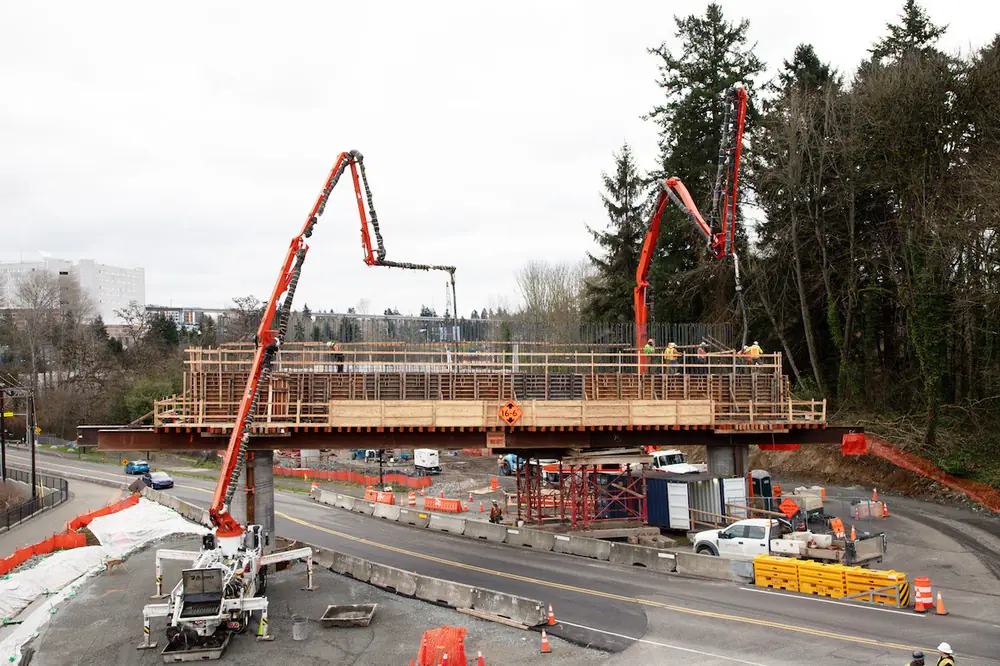
Infrastructure inefficiencies — such as power outages, uneven roads, sitting in traffic, posted load restrictions on bridges, leaking water pipes, and congestion or delays at airports and seaports — have consequences for businesses and, ultimately, consumers.
In the Continuing to Act scenario, each U.S. household is losing $2,000 per year due to these inadequate systems, while the Snapback analysis predicts nearly $2,700 in individual household losses annually — meaning American families save nearly $700 per year from continued infrastructure investments.

| Your local Hyundai Construction Equipment USA dealer |
|---|
| Nueces Power Equipment |
| Nueces Power Equipment |
| Nueces Power Equipment |
| Nueces Power Equipment |
These are marked improvements from ASCE’s last economic report, “Failure to Act,” which was issued prior to IIJA and estimated households lose $3,300 per year due to faulty infrastructure. However, while American families and businesses benefit when the federal government continues to act, the federal government alone cannot solve this problem that was decades in the making; state and local governments, in addition to the private sector, must prioritize infrastructure to further reduce costs to households, the report says.
“We failed to prioritize America’s infrastructure systems for decades, and those costs were passed down to businesses and consumers alike,” said Marsia Geldert-Murphey, ASCE President. “Federal action has made substantial progress stopping the growth of our needs, but this is just the beginning. We need continued action at the federal level and collaboration from state and local governments and the private sector if we are going to succeed in transforming our aging infrastructure network to be more sustainable, resilient, and best suit the future needs of American households and businesses.”
By 2033, the manufacturing sector would lose $1.15 trillion due to inefficient infrastructure in the Snapback scenario, compared to $877 billion in the Continuing to Act scenario — a difference of $276 billion. The difference in the two scenarios until 2033 is $198 billion for the finance, insurance, and real estate industries; $81 billion for healthcare; and $37 billion for mining, utilities, and agriculture.
Examples of changing circumstances noted in the report include:
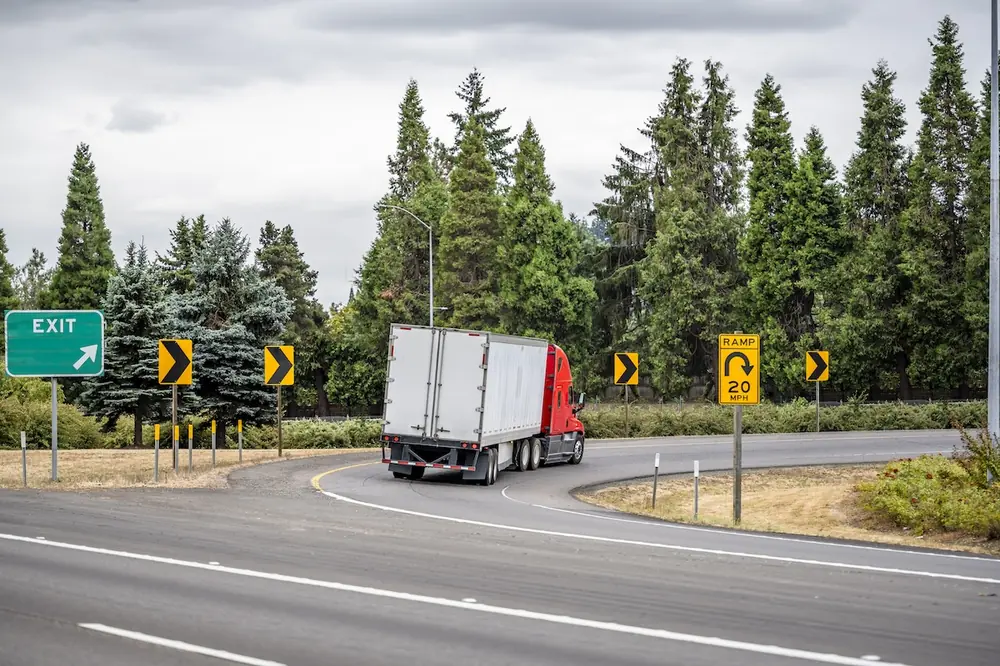
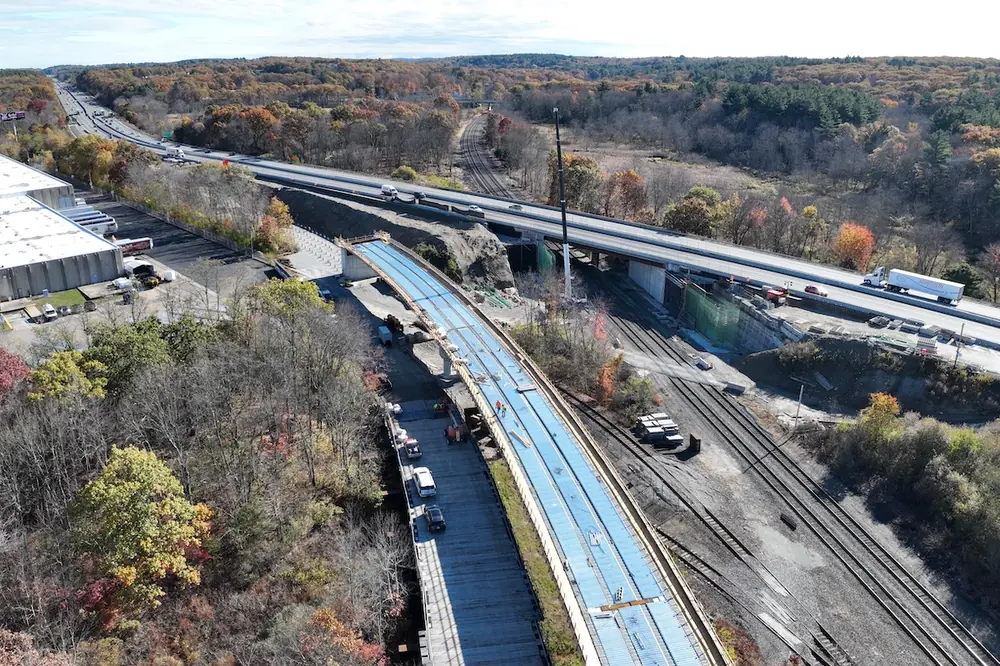
- Transportation — Transit ridership is just 73 percent of pre-pandemic levels, and roadway travel patterns have changed since 2020 with vehicle miles traveled increasing due to a 15 percent spike in private car trips as work from home or hybrid work arrangements become more common.
- Energy — Currently 22 states and the District of Columbia have implemented net-zero carbon emission goals while 29 states and the District of Columbia have adopted Renewable Portfolio Standards, requiring providers to rewire America’s electric grid, which has caused energy investment needs to soar.
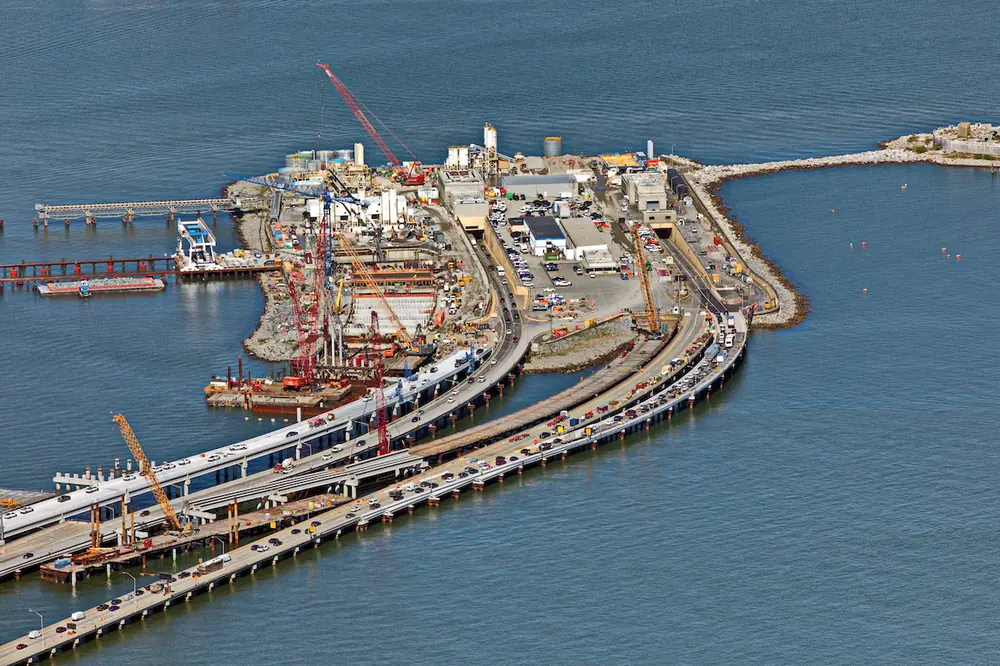
- Ports and inland waterways — Supply chain instability, emerging trade patterns, technological advancements, and environmental regulations have heightened the need for ports and inland waterways if the U.S. is to maintain efficient international trade.
- Resilience across all sectors — Increasingly, severe weather events significantly impact each sector as engineers adopt necessary changes to construction methods and safeguard existing structures.
The influx of federal investments has either reduced or maintained the investment gaps in the transportation, water, water transportation, and aviation sectors. However, policy changes and underinvestment in brick-and-mortar energy structures have caused the energy investment gap to skyrocket since 2020 — from $208 billion over 10 years pre-IIJA to $578 billion in the Continuing to Act scenario and $702 billion in the Snapback scenario over 10 years.
Between now and 2033, the ASCE report estimates that nearly $7.4 trillion is needed across 11 infrastructure areas: highways, bridges, rail, transit, drinking water, stormwater, wastewater, electricity, airports, seaports, and inland waterways. Under the Continuing to Act scenario, approximately $4.5 trillion in investment is anticipated, which covers approximately 60 percent of total needs, leaving a gap of $2.9 trillion. Under the Snapback scenario, $3.7 trillion is anticipated, which covers less than 50 percent of total needs and leaves a gap of more than $3.7 trillion by 2033.
- More than $1 trillion in gross output by 2033 and $5 trillion by 2043.
- More than $45 billion in U.S. exports by 2033 and $244 billion by 2043.
- Saving 237,000 jobs in 2033 and 344,000 jobs in 2043.
“The ASCE report makes clear that big increases in public funding delivered under bipartisan infrastructure bills must continue,” said Jon Phillips, CEO of the Global Infrastructure Investor Association. “But that alone is not enough. Private investors see a huge opportunity to help state and city governments with the private finance and expertise they need to fix their problems. These global investors have decades of experience of working with public sector partners to finance and manage high-quality infrastructure in countries like Canada, the U.K., mainland Europe, and Australia. They now see the opportunity to help in the U.S. and are willing and ready to play their part.”
A research team comprised of EBP, Downstream Strategies, Daymark Energy Advisors, and the Interindustry Forecasting Project at the University of Maryland worked with ASCE to develop this study.
To view the full report and additional data, visit bridgingthegap.infrastructurereportcard.org.