

In my early days as an industrial designer, I would cringe when a product manager came into the studio saying, “Just gimme a sketch.” I was annoyed because it felt like design was being unappreciated as a valuable process in the development scheme.
It seemed the value of my training in the craft and my insights — the rigorous thought processes balancing user needs, costs, and manufacturing criteria — was seen as easy as pulling a rabbit out of a hat. Oh, my poor youthful and energetic ego.
In maturing as a designer, I began to realize the power of that sketch, no matter how it was requested, and I got better at providing visuals that described the proposed design and the narrative of use. Notes and details calling out the decisions that had been made were appreciated and the nods of understanding became cues to continue with development.
Those sketches and visuals became the mutually understood vision for the development team. They were artifacts of understanding and commitment.
Visualization assists in creating understanding — and this approach of making things clear to everyone in a room now applies more than ever to construction planning.

Visualization can be defined as the process of creating a mental or physical representation of an idea, concept, or plan to make it easier to understand, communicate, and act upon. It transforms abstract thoughts into tangible forms such as sketches, diagrams, models — or even a series of sticky notes — so others can “see what you mean” and share a common understanding.
Nature offers compelling examples of the value of visualization through species like bowerbirds and peacocks. Male bowerbirds meticulously construct elaborate structures decorated with colorful objects to attract mates. These structures are not functional shelters; they are visual displays that communicate fitness, creativity, and resourcefulness. Similarly, peacocks use their vibrant, iridescent tail feathers as a visual signal of health and genetic quality.
In both cases, visualization serves as a persuasive tool — an externalized representation of internal qualities — helping these species achieve their goal of reproduction. These natural examples underscore how visualization is an innate and relatable concept that can influence decision-making and foster alignment, whether in product development or construction planning contexts.
Disciplines that rely heavily on visualization span art, architecture, and science, where making ideas visible is essential for progress.

| Your local Trimble Construction Division dealer |
|---|
| SITECH Northwest |
| SITECH Northwest |
| SITECH Northwest |
| SITECH Northwest |
Leonardo da Vinci, for example, used sketches not only to design machines and produce anatomical studies but also to explore concepts that were centuries ahead of his time. His drawings served as both a thinking tool and a communication medium, bridging imagination and reality.
Similarly, architect Frank Gehry employed physical models and free-form sketches to translate abstract ideas into structures that challenged conventional design and construction. His process demonstrated how visualization can unlock creativity and guide complex engineering solutions.
In science, visualization is equally critical. Consider a chemist working on molecular structures: diagrams and 3D models allow researchers to understand atomic arrangements, predict reactions, and communicate findings effectively. Without these visual representations, the complexity of molecular interactions would remain inaccessible.
Across these disciplines, as in construction, visualization transforms ambiguity into clarity, enabling collaboration, innovation, and informed decision-making.

| Your local Metso Minerals Industries Inc dealer |
|---|
| PacWest Machinery |
| Westate Machinery Co |
| PacWest Machinery |
| Westate Machinery Co |
| PacWest Machinery |
| Westate Machinery Co |
| PacWest Machinery |
| Westate Machinery Co |
In construction planning, visualization can be as simple and powerful as using sticky notes to map out tasks. By placing each activity on a note and arranging them on a wall or board, teams create a clear, shared picture of the entire workflow. This visual plan shows who is responsible for what and when, making dependencies and handoffs obvious. When everyone can see the sequence of tasks, it becomes easier to confirm that milestones will be met and identify potential bottlenecks before they occur.
This approach cultivates alignment and accountability. Instead of abstract schedules buried in spreadsheets, the sticky-note plan turns the timeline into a tangible, interactive display. Team members can move notes as priorities shift, immediately seeing the impact on downstream tasks. The result is a dynamic, collaborative planning tool that ensures handoffs happen on time and the entire team understands the path to success.
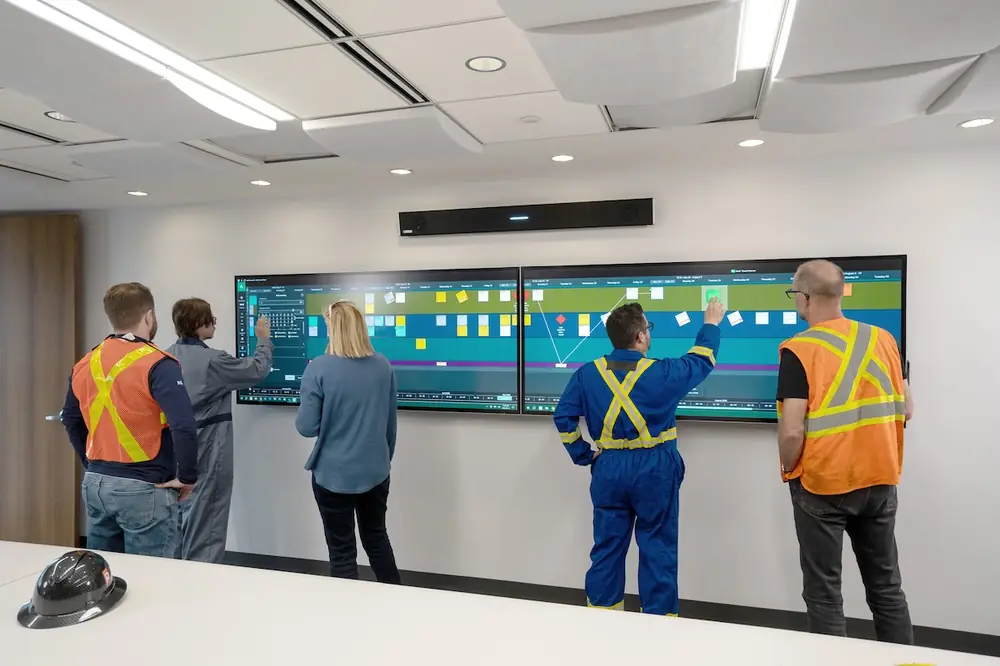
Planning activities, recording the status of activities being completed or not, tracking actual versus planned milestones, and generating reports from the data offer immense value to teams striving for on-time and on-budget completion. Technological tools allow for visualization at a more detailed level — akin to the intricate details of a peacock’s feather.
There are also other aspects of visualizing plans. Activity tags can be colored in a consistent way so they are uniform and don’t make the eye dart between fields, similar to unicolored sticky notes. The consistent colors make it obvious for the owner of an activity to see their commitments on a large display.

| Your local Superior dealer |
|---|
| Westate Machinery Co |
| Westate Machinery Co |
| Westate Machinery Co |
| Westate Machinery Co |
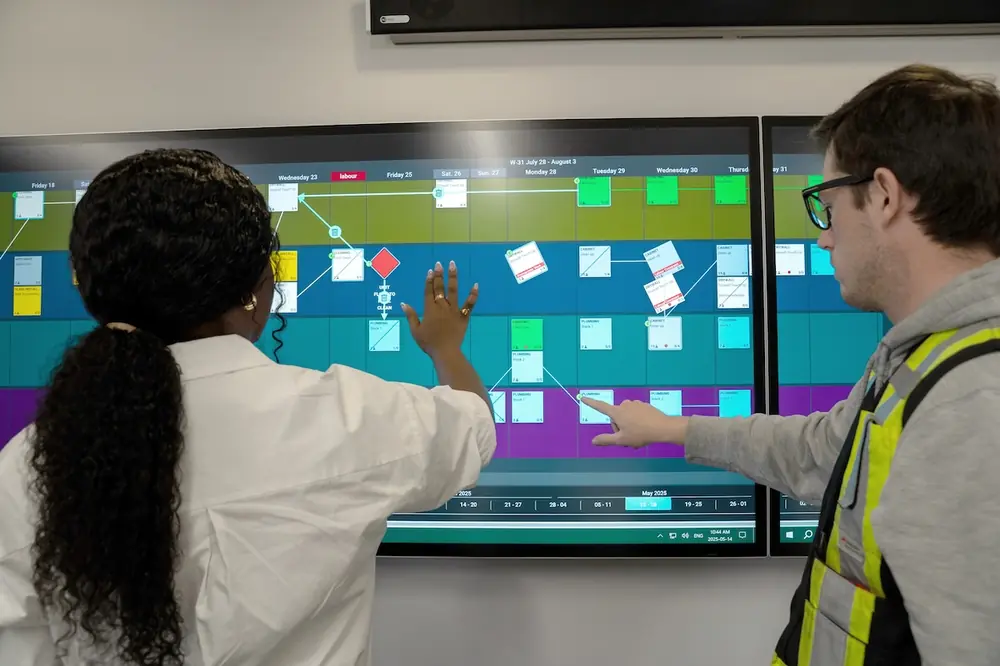
With the capabilities of a digital solution, subtle connector lines between tags can help the owner see the sequence of their activity. While difficult on a physical sticky note wall, digital planning software enables logic ties between activities that are dependent on each other, with the common signals of green if they are on track and red if the preceding activity goes later than the committed handoff date. Visual alerts appear on activity tags that have constraints and therefore cannot be completed. As is the case on a sticky note wall, if a task is not completed by the due date, the tag is tilted and shows the reason it wasn’t done, highlighting the activity’s status as being an anomaly visually.
All these visual elements work together to provide a simple and understandable map of a project’s flow and health.
Visualization is powerful because it helps teams see and understand the work that needs to be done to complete a project safely, predictably, and on time. In construction, where success depends on coordination across many people and moving parts, that shared understanding is invaluable.
The principle behind visual planning is timeless: when people clearly see the plan, they are better able to align around it, act on it, and improve it. What digital tools add is the ability to sustain that visibility at scale — across larger teams, longer timelines, and more complex projects.

| Your local Bobcat dealer |
|---|
| Pape Material Handling |
| Pape Material Handling |
| Pape Material Handling |
Alan Boykiw is Senior Experience Architect at Nialli Inc., where he leads product design for digital solutions that enhance collaboration and efficiency in construction planning.