


The transformation of the American middle market over the past 20 years is nothing short of remarkable.
What was once a market of 200,000 businesses, each with revenue of $10 million to $1 billion, has consolidated into a segment made up of fewer but more robust companies.
Today, the middle market consists of 125,000 businesses, each with revenue of $30 million to $10 billion. This cohort is far more resilient than the middle market of the past, and it represents a critical, upscale, and profitable element of the $30 trillion U.S. economy.
That transformation demands a quantitative reexamination of this vital segment.
As the transformation continues, firms that generate revenue of $2 billion to $5 billion will likely represent the sweet spot for growth in the near to medium term.

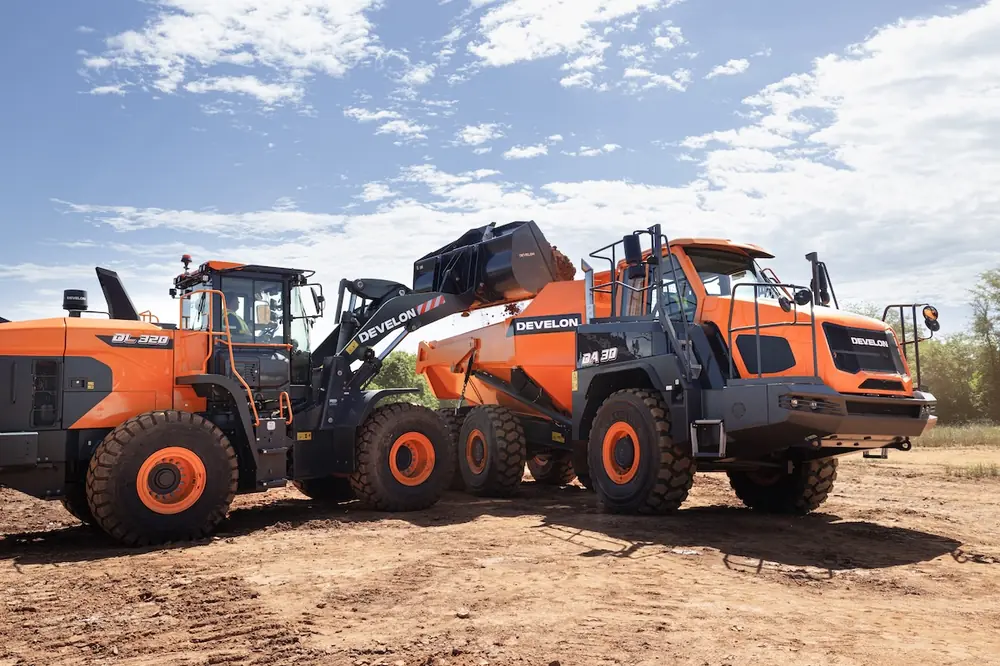
| Your local Hyundai Construction Equipment USA dealer |
|---|
| Nueces Power Equipment |
| Nueces Power Equipment |
| Nueces Power Equipment |
| Nueces Power Equipment |
The middle market consists of eight subsegments, each with its own characteristics, access to capital, and technological matrices.
We conducted a deep examination of these subsegments, as well as the structural changes that have taken place in the middle market since the 2007-2009 financial crisis and pandemic-era economic disruptions.
In our estimation, the maturation of the middle market, like other segments of the American economy, reflects broad differences in size and scale of middle market firms, which have different qualitative and quantitative needs with respect to capital, technology, and labor compared to smaller and larger businesses.
Middle market businesses have experienced significant changes in operational complexity over the past decade — and the rapid pace of change is likely to continue.

| Your local Hitachi dealer |
|---|
| ASCO Equipment |
| ASCO Equipment |
| ASCO Equipment |
| ASCO Equipment |
As such, it is imperative to redefine the middle market, ensuring that we understand the origins and catalysts of this operational complexity so that we can provide a roadmap to maximize enterprise value for these firms.
We must also consider that the middle and upper segments of the middle market are likely to experience faster growth compared to the smaller end, given their ability to integrate sophisticated technology into their operations as well as their greater access to private sector capital — both bank-driven and private equity funded.
Based on our research, middle market companies now generate more revenue at both ends of the spectrum, supporting our conclusion that the segment now comprises companies with annual revenue between $30 million and $10 billion.
This definition is in line with the significant economic expansion during the past decade and the American exceptionalism that has defined growth compared to other developed economies.

| Your local Astec dealer |
|---|
| Closner Equipment Co Inc |
| Closner Equipment Co Inc |
| Closner Equipment Co Inc |
| Closner Equipment Co Inc |
But it also means that the number of middle market companies has declined.
Today, approximately 125,000 companies fit our new definition. This contraction is consistent with the consolidation of the U.S. market since the financial crisis and the pandemic, both of which had a major impact on market structure.
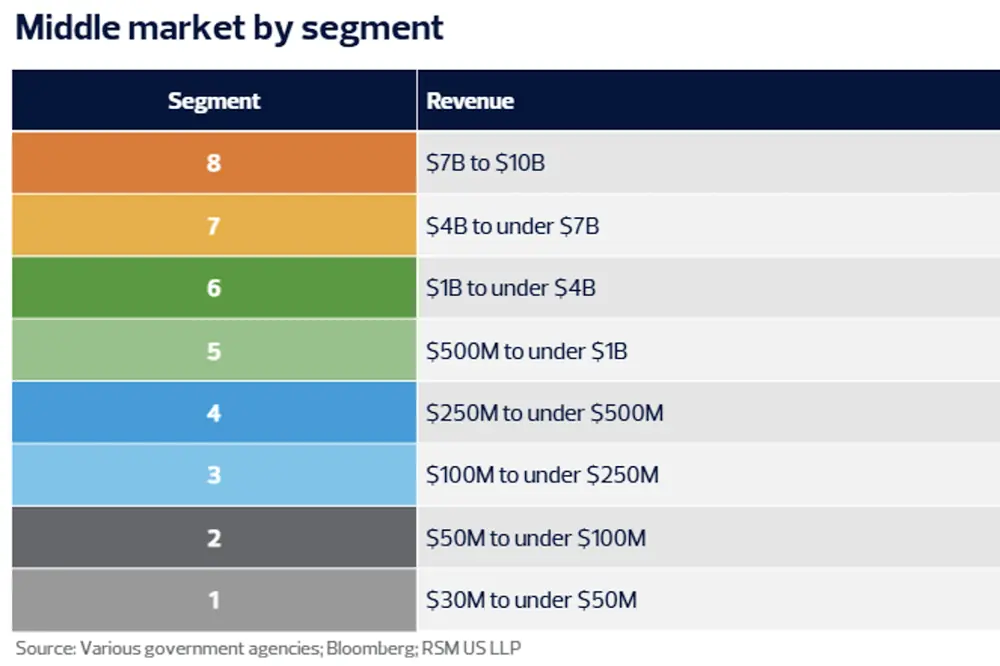
To better understand the middle market, we have divided it into eight subsegments, each accounting for about $1.5 trillion to $2.5 trillion in total revenue. Those subsegments are summarized in the chart called “Middle Market by Segment.”
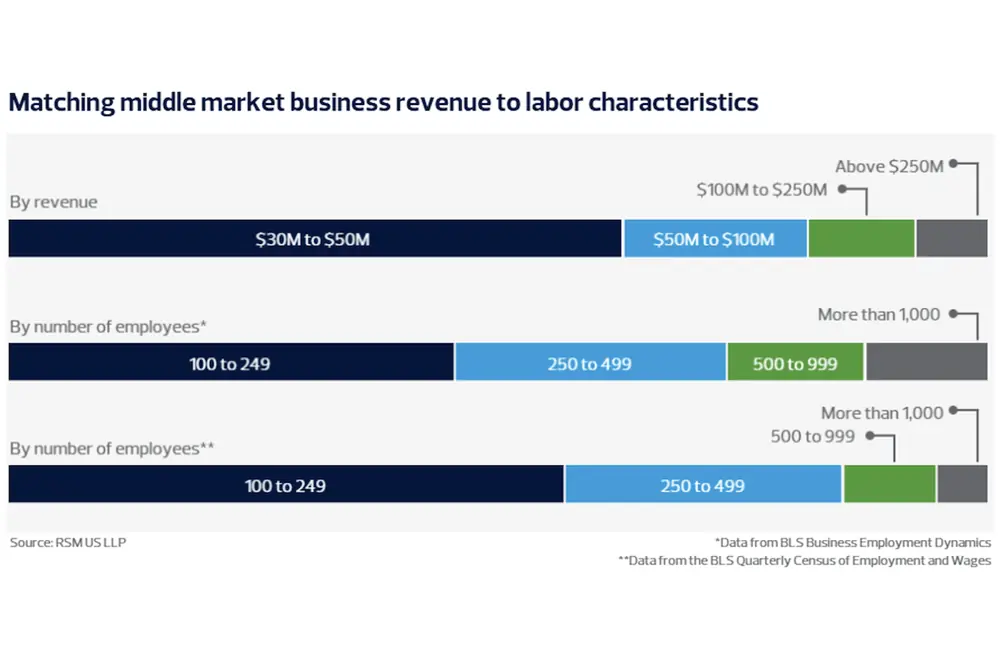
But revenue is just one element that defines these subsegments. We also look at labor, by leveraging data from the IRS, the U.S. Bureau of Labor Statistics (BLS), Bloomberg, and Forbes. In all, the middle market employs 50 million people.

Our core assumption is that a strong correlation exists between a firm’s employee count and its revenue. Using this relationship, we align employee data with revenue estimates based on the distribution of each metric.
For firms at the upper end of distribution, particularly public companies, the match is more precise because of the greater availability and reliability of financial data. Those firms have annual revenue between $1 billion and $10 billion.
For smaller firms, it is much less clear-cut. We match the labor and revenue data by comparing the distribution of firms across revenue and employment spectrums. That process is shown in the accompanying chart, called “Matching Middle Market Business Revenue to Labor Characteristics.”
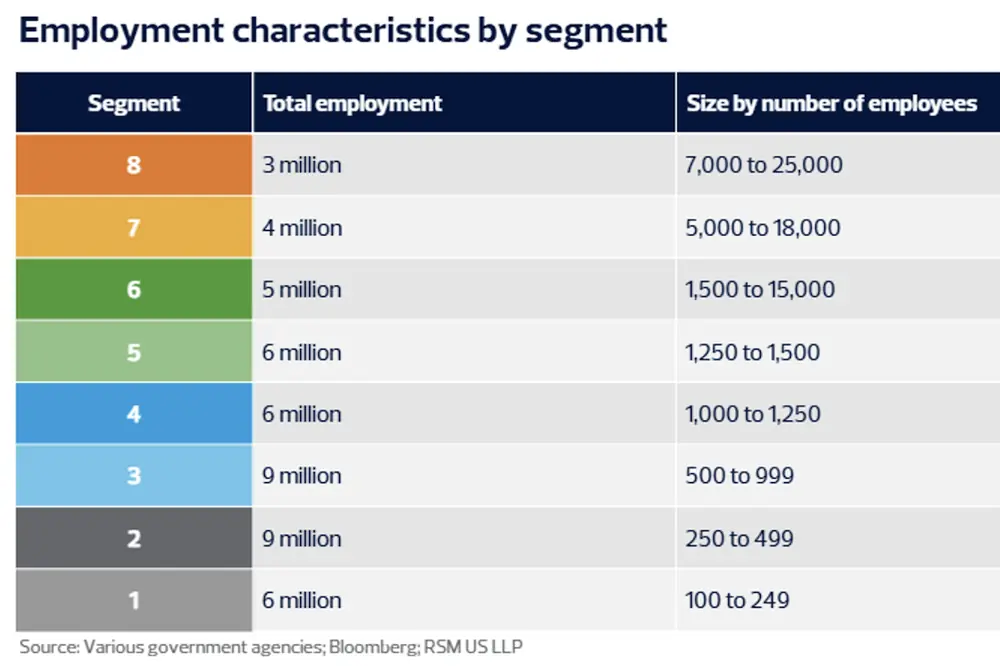
Following a similar process, we look at firms with larger revenue then summarize the result in the table called “Employment Characteristics by Segment.”

| Your local Komatsu America Corp dealer |
|---|
| WPI |
| Kirby-Smith Machinery |
| WPI |
| Kirby-Smith Machinery |
| WPI |
| Kirby-Smith Machinery |
| WPI |
| Kirby-Smith Machinery |
Consolidation across the U.S. middle market has not followed a simple trajectory over the past 20 years. Rather, firms populating the niche moved upmarket as the domestic economy was transformed by economic crises.
That shift has resulted in a far more complex, dynamic, and resilient market — one that demands a different framework for understanding.
Recent data underscores this change, and firms that operate in this rapidly changing landscape must integrate sophisticated technology to deliver goods and services to an increasingly upscale customer base.
The only constant in modern business is change — and the American middle market is poised to lead that change.